A Long-Term Diagnosis
(Cover Image Source: Jan Romero)
As we start to assess the events of 2020, the over-riding feeling is a sense of relief, not just that we have physically made it through one of the strangest years in living memory, but also that markets are finishing the year if not at their highs, then certainly well off their disastrous March / April lows.
Bifurcation is a word that has been used regularly in the office during the year, describing as it does the division of something into to two parts, and equity markets have certainly fit that description. Whilst the technology-laden Nasdaq has soared by over 40% in US Dollar terms, most major European markets (which, for the time being at least, includes the UK) have struggled to make it into positive territory. (The MSCI Pan Europe Index is down 7%, whilst the FTSE 100 is down nearly 13%).
Whilst market returns have seen significant divergence, price volatility within indices themselves has, perhaps unsurprisingly given the sharp fall and subsequent recoveries, also been at near record levels. The MSCI World index consists of approximately 1600 of the world’s largest companies and is divided up into 9 Industry sectors. The following chart shows the cumulative returns from those 9 sectors over the course of 2020:

Barring any sudden changes, the MSCI Index itself (Driven by US and Asian markets) is on track to record a return of around 13% (in US Dollar terms) for the year. Within the various industry sectors however, whilst most returns are clustered in the 5% to 15% range, Technology stocks are presently up 40%, whilst Energy shares are down 32%, giving a range of returns of over 70% between the best and worst sectors.
Whilst the year has certainly felt volatile in any number of ways, it’s interesting to compare the variation in industry sector returns during this year to previous periods. The following chart shows the range of outcomes each year between the best (green dot) and worst (red dot) sectors annually from 2000, together with the actual overall index return (Blue dot) for each year.

As many will have intuitively suspected, the events of 2020 have indeed resulted in the largest variability in sector returns during the last 20 years, a period, lest we forget, which encompasses the 911 attacks and subsequent war on terror, the technology bust, the 2008/2009 financial crisis, the Japanese tsunami, the European debt crisis, the Brexit vote, and Donald Trump. Bifurcation indeed, and perhaps reflective of the truly global nature of the division between industries that have thrived during the Covid lockdown, and industries that are surviving only by dint of government assistance.
With the recent out-performance of (and ever-present media attention afforded to) the technology sector, it is easy to believe that the likes of Tesla, Amazon, Facebook and their ilk have been market leaders for a protracted period of time. The 10 largest companies in the S&P 500 at present are:
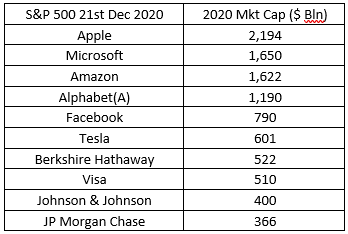
If we consider the same 10 largest companies in December 1999, things looked remarkably different:

Only Microsoft remains from the original 10, and the drop in market value (that is shareholder value) in some of the other constituents from the end of the millennium is nothing short of spectacular. (AIG, being the source of much of the derivative losses during 2008 /2009 is a shadow of its former self).
If we consider the MSCI World Index once again, it seems logical to assume, given the ascent of the major technology companies, as has been the case in 2020, that the sector has significantly outperformed for a long period of time. The reality however is slightly different:
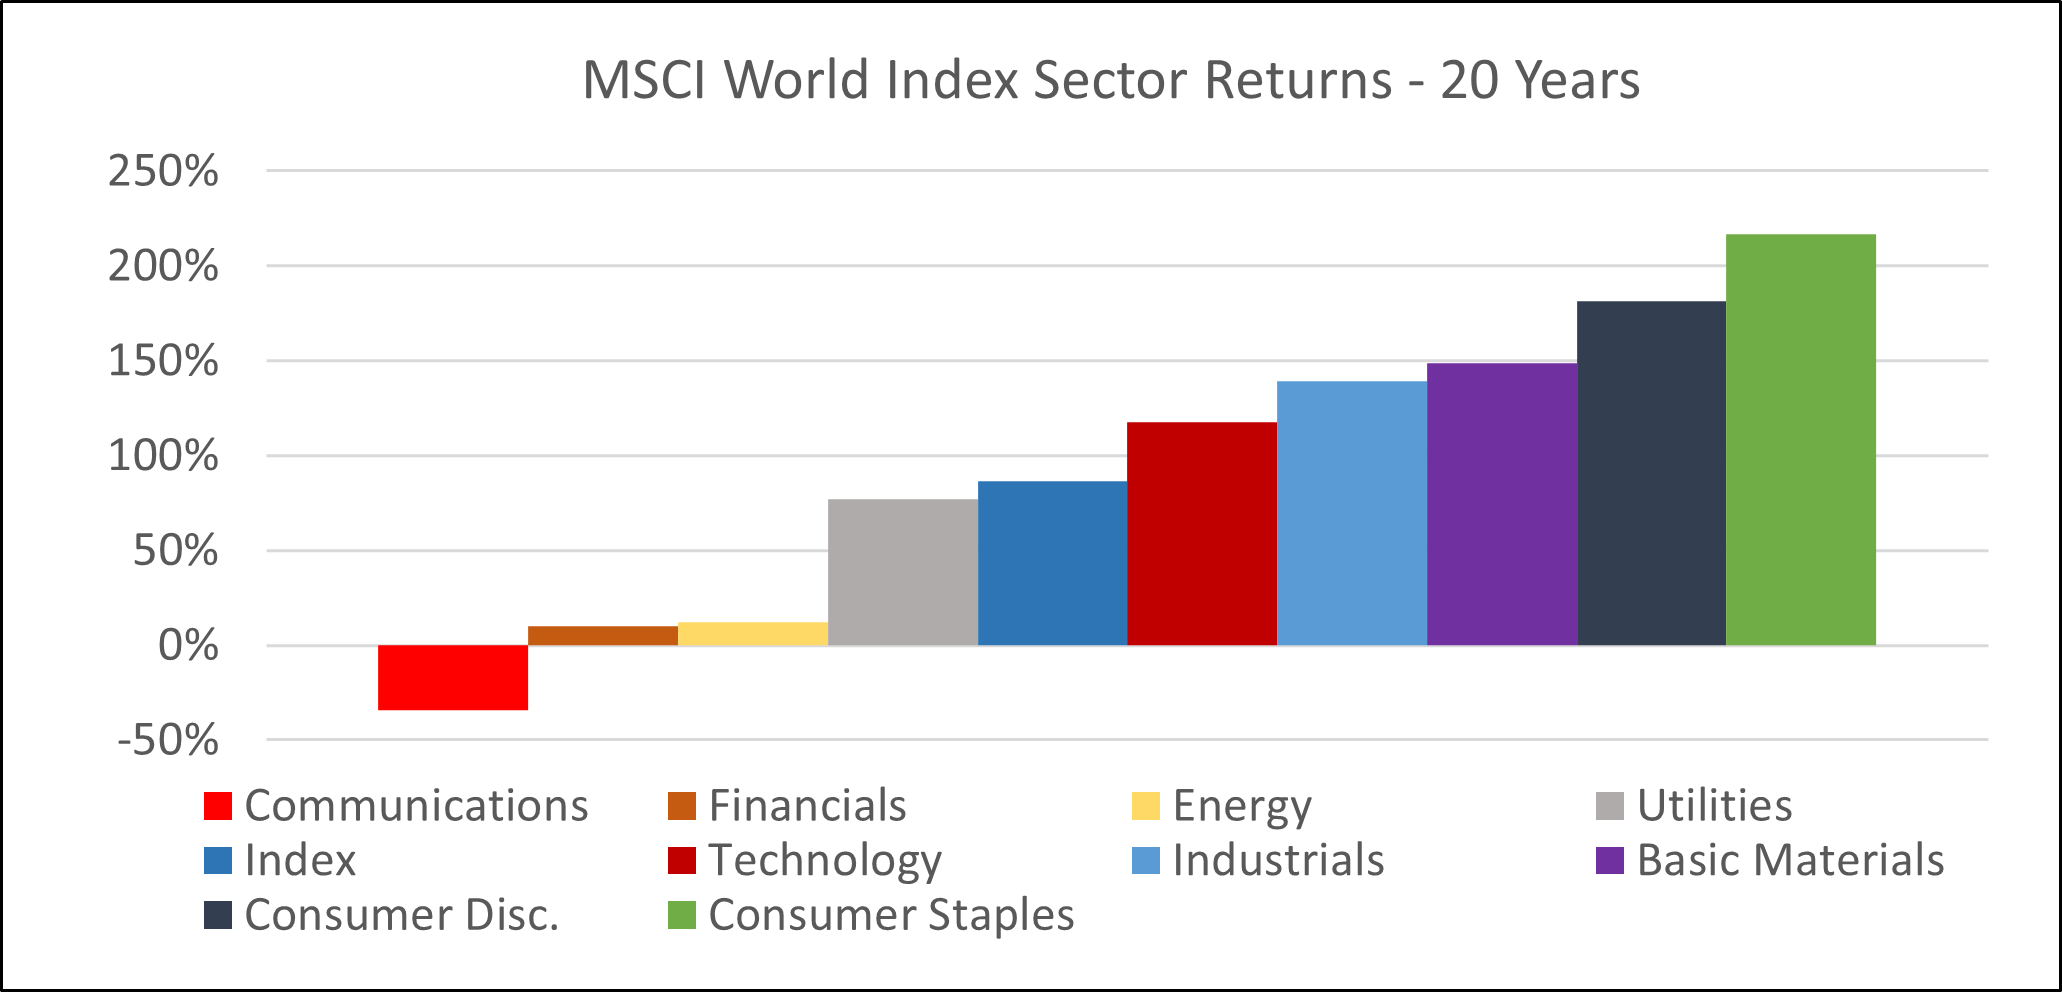
The best performing sector over the 20-year period has in fact been Consumer Staples, the likes of Unilever, Coca Cola and Colgate Palmolive, which have returned over 200% in total. The technology sector by comparison has shown a return of 117%. (This is a slightly unfair comparison, as it includes the period from 2000 to 2002, when the technology sector lost 75% of its value, and from which point the sector has returned nearly 800%).
What is also interesting when considering the above returns is to look at the volatility of annual performance numbers, to get some idea of how consistent returns have been. (Volatility, or risk, being the price we pay for our returns).
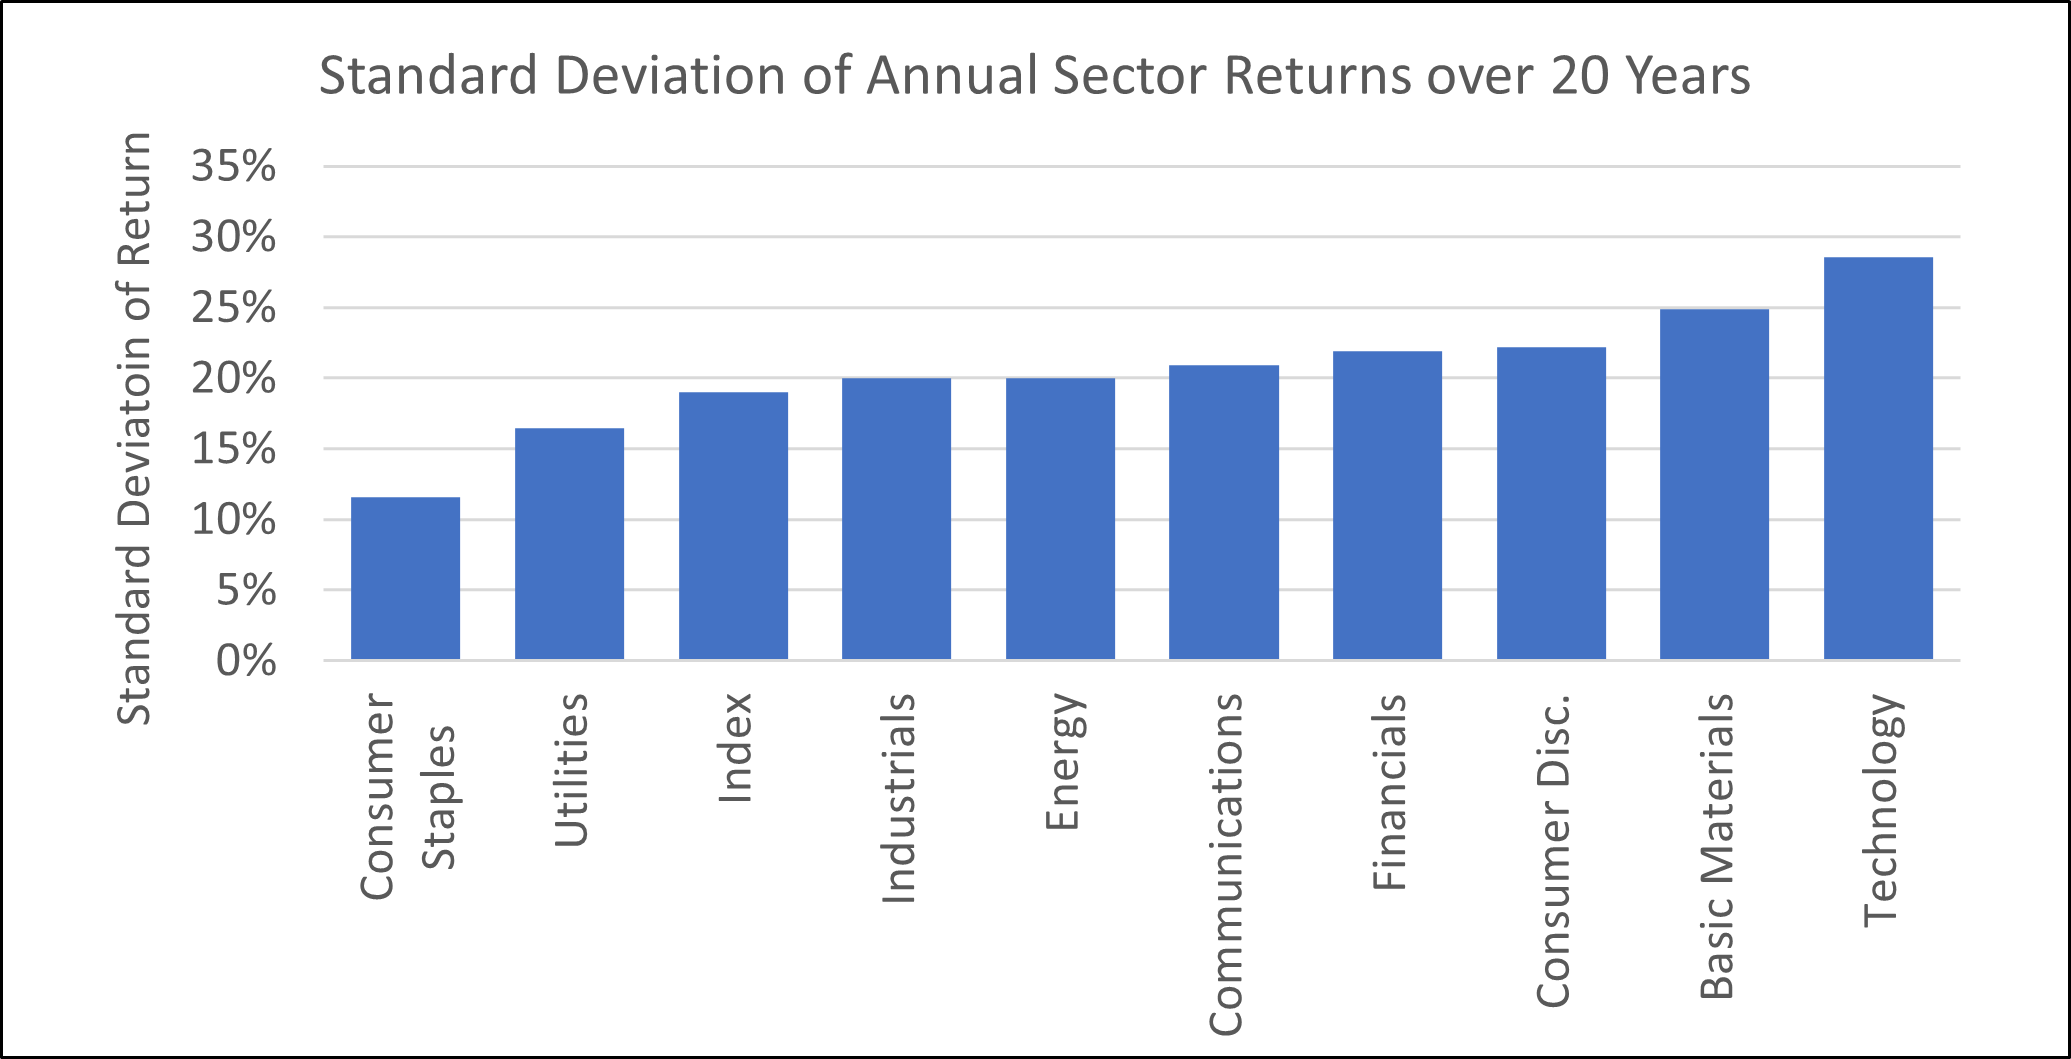
What is most remarkable about the above chart is that the highest returning sector over the last 20 years has also exhibited the lowest level of return volatility. That Buffet chap may well be onto something.
So, as we stare in 2021, what do we know about global markets? The largest companies in the world at present are major US technology companies, whose growth rates and levels of cash generation are almost unprecedented. We also acknowledge however that our mantra of ‘investing in our daily life’ leads us, as well as technology giants, to consider strong brand leaders in value sectors as being worthy of continued support.
With the fastest growing middle class, emerging market consumption of premium brand western products is accelerating, however Asian companies are starting to appear in the upper echelons of the world’s largest corporations. These companies, given their size, are presently under-owned by Western investors, and this, along with other major themes such as urbanisation, demographic change and resource scarcity will have increasing impact, and will no doubt drive the World Index to look very differently to the present in 20 years from now.