The (Not So Quiet) Inflation Battle
Recent US inflation prints have Wall St whooping again, forcing hyper-data sensitive markets to (re)adjust the likely path for interest rates over the remainder of 2024 and 2025. The inflation battle is over. Isn’t it?
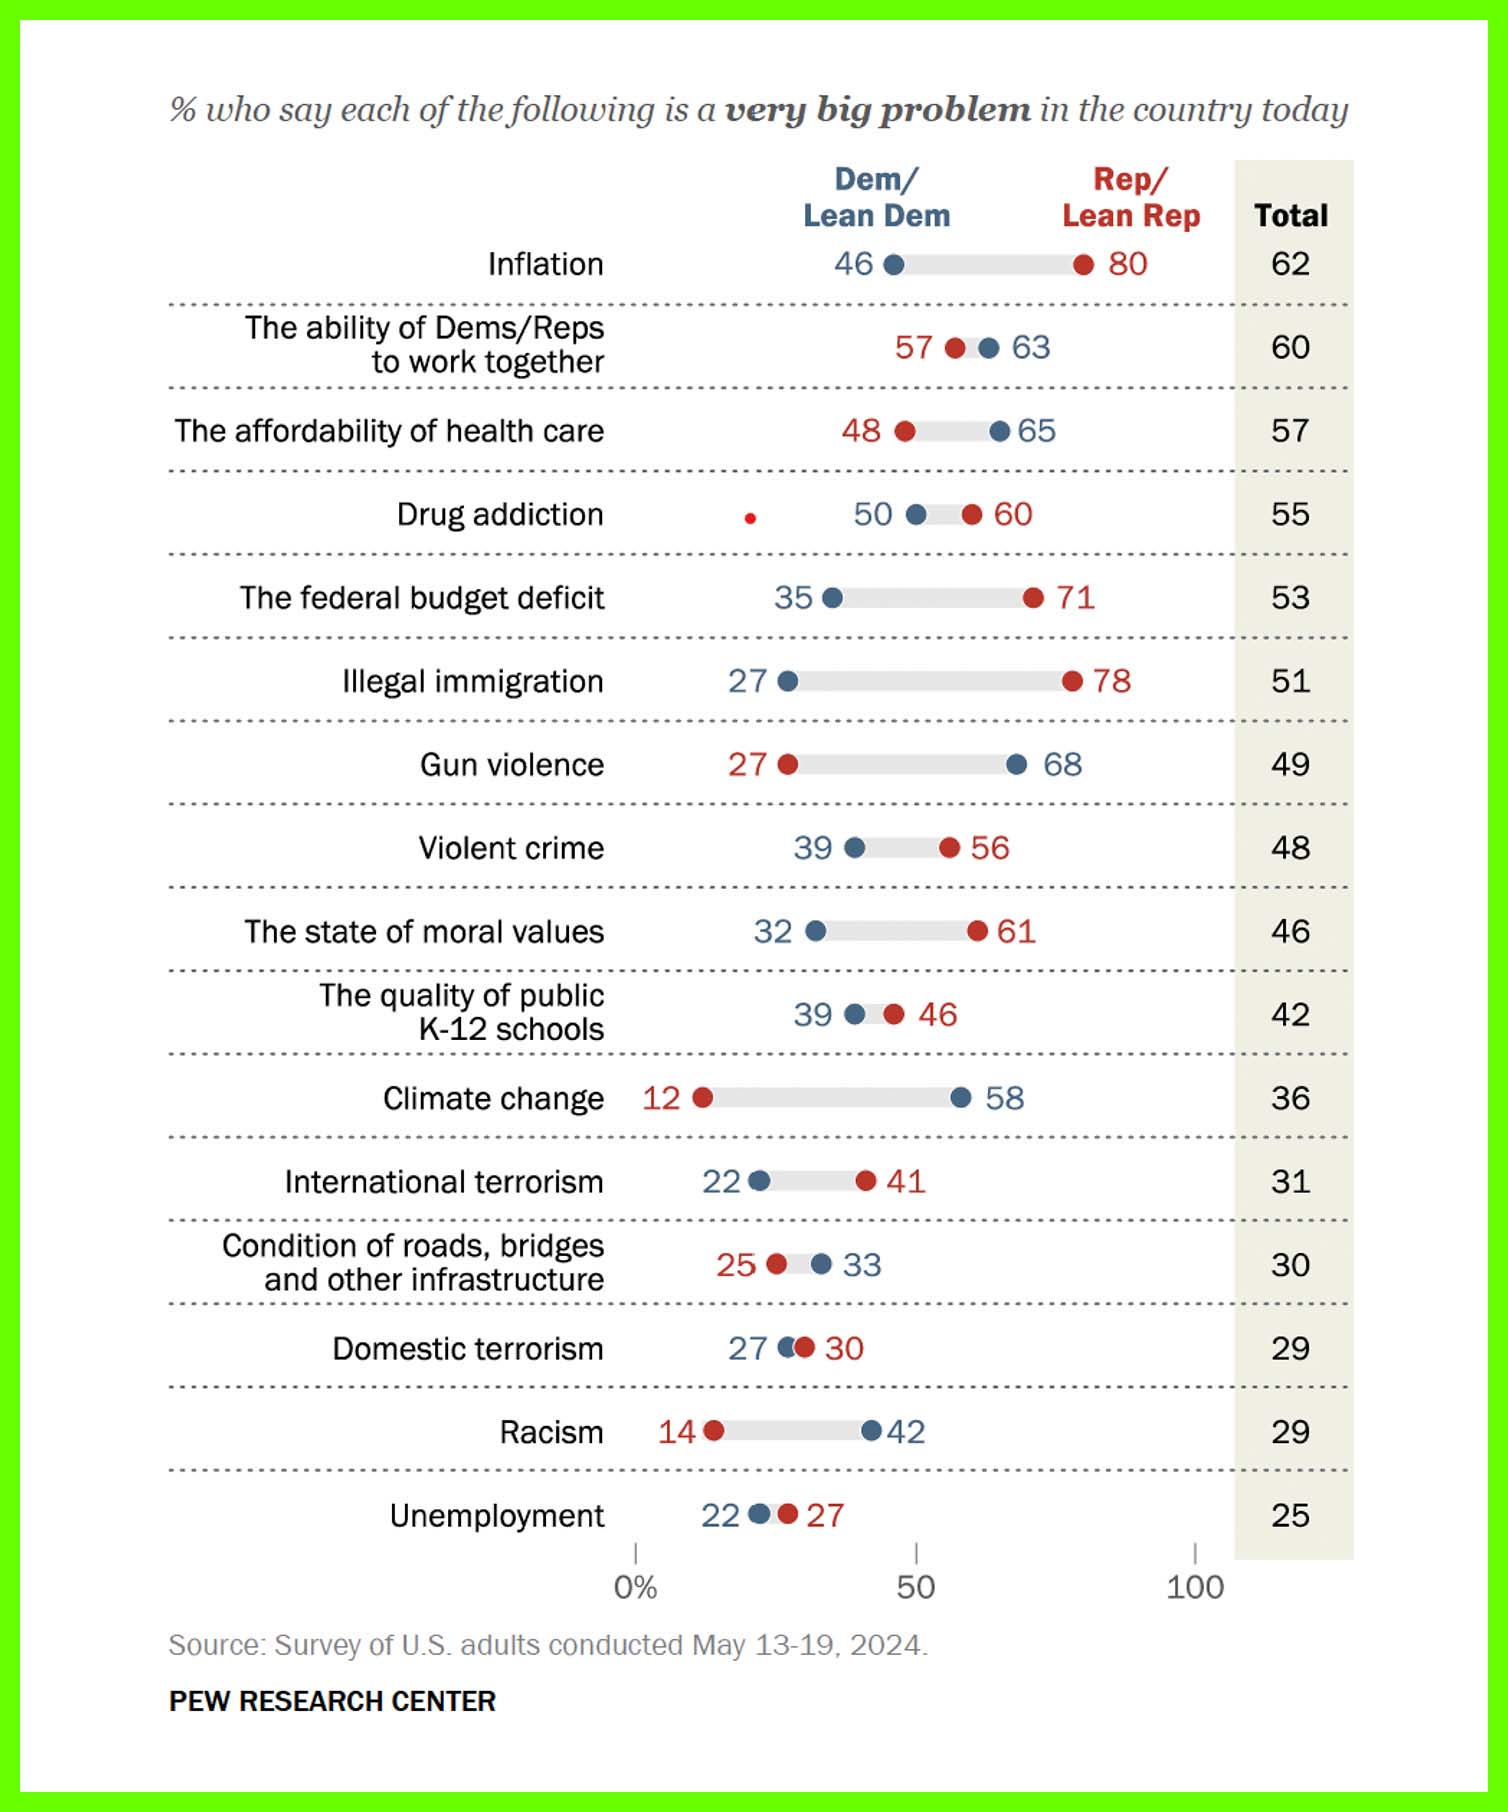
Main Street, it would seem, disagrees. And strongly. Only a few short weeks ago, the Pew Research Center published its most recent survey of adult Americans. Fully 62% of respondents representing the Blues and Reds say that inflation in America remains a very big problem. In fact, it tops the laundry list of concerns:
What gives?
Putting aside political tendencies, the crux of the issue is that the construction of the Consumer Price Index (CPI) basket, produced monthly by the US Bureau of Labor Statistics, and the most widely followed barometer of aggregate inflation by markets, bears little-to-no resemblance to the cost-of-living outcomes experienced by ordinary, working-class Americans.
The reason that this is a major problem, and one set to deepen, is that the CPI basket is utilised as the primary inflation measurement tool in critically important areas that affect American lives, from benchmarking salary increases to returns on investment portfolios for retirement plans.
If people are keeping up with, or slightly beating the CPI in terms of their salary and portfolio returns, why are they falling further behind in terms of their standards of living? Examples including a record number of Americans relying on entitlement programmes1, the record number of 52 million Americans living now is what are termed ‘distressed zip codes’ across the US2, and rapidly rising credit card delinquency rates3.
Enter the Chapwood Index, created by Ed Butowski, which seeks to remedy the manipulation, biases, and adjustments, that have been introduced into the CPI basket calculation since 1983, and which by Ed’s admission, has under-reported the real cost of living increase by approximately 7-8% per annum.
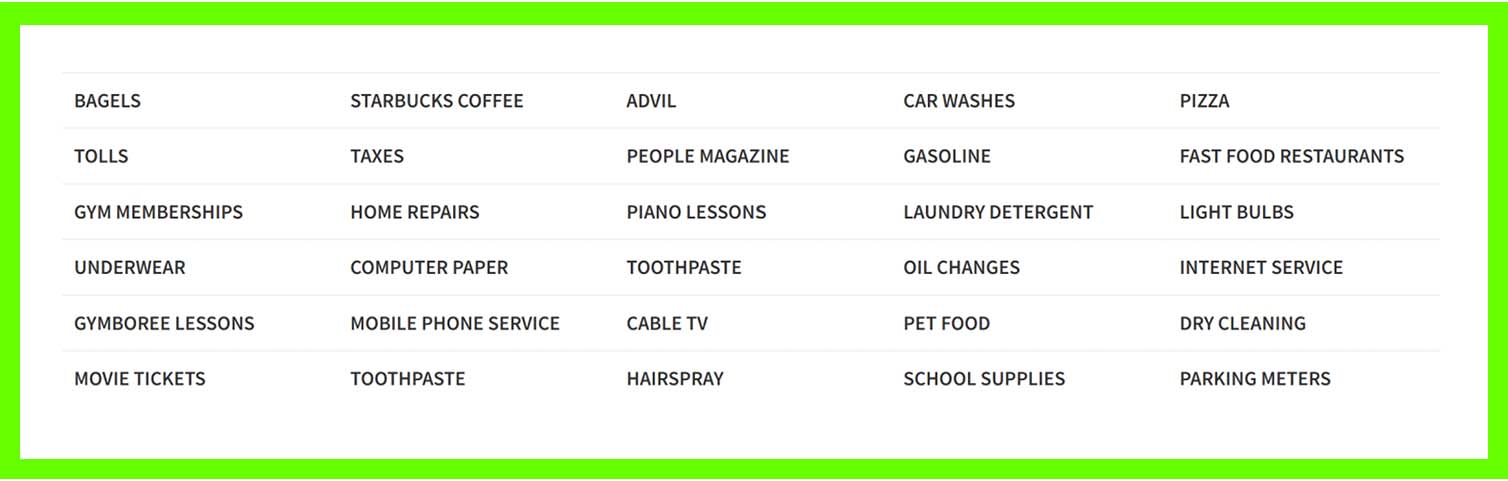
The Chapwood Index is constructed by data-scraping Facebook and various social media sites to source the 150 most frequently used items by American households during the regular course of their lives. Examples of items are:
The index is price-weighted, completed for 50 major metropolitan areas in the country, and published annually. The latest full-year results of the Chapwood Index are shown below:
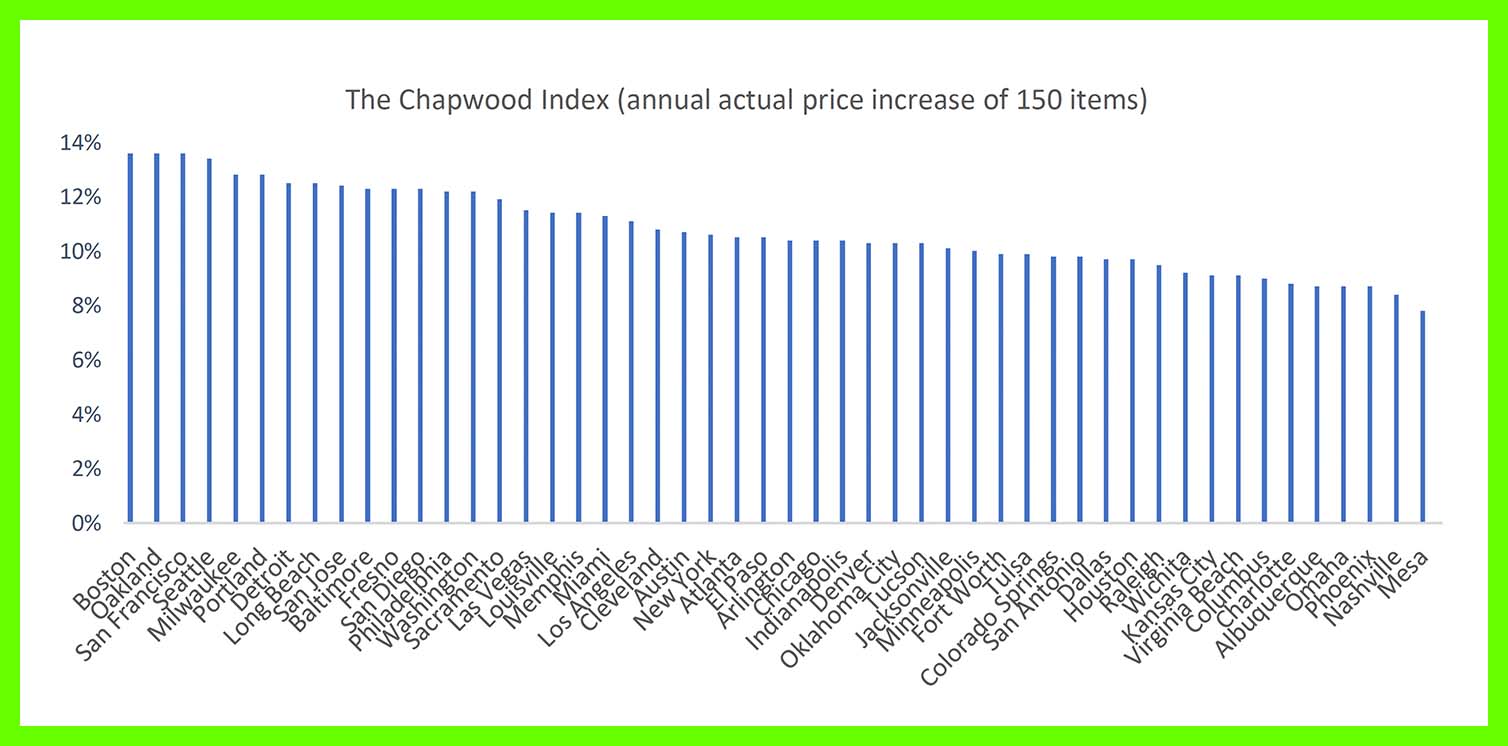
The numbers resonate closely with the original CPI basket calculations that have been produced by John Williams’ Shadow Government Statistics and go some way to explaining why Americans are not feeling better off in financial terms, despite noisy headlines around ‘real’ wage increases of late.
On the contrary, many feel worse off, and are becoming vociferously more vocal about it. Inflation remains an emotive topic as we head into the US election home straight. The not-so-quiet battle rages on.