2000 Repeat?
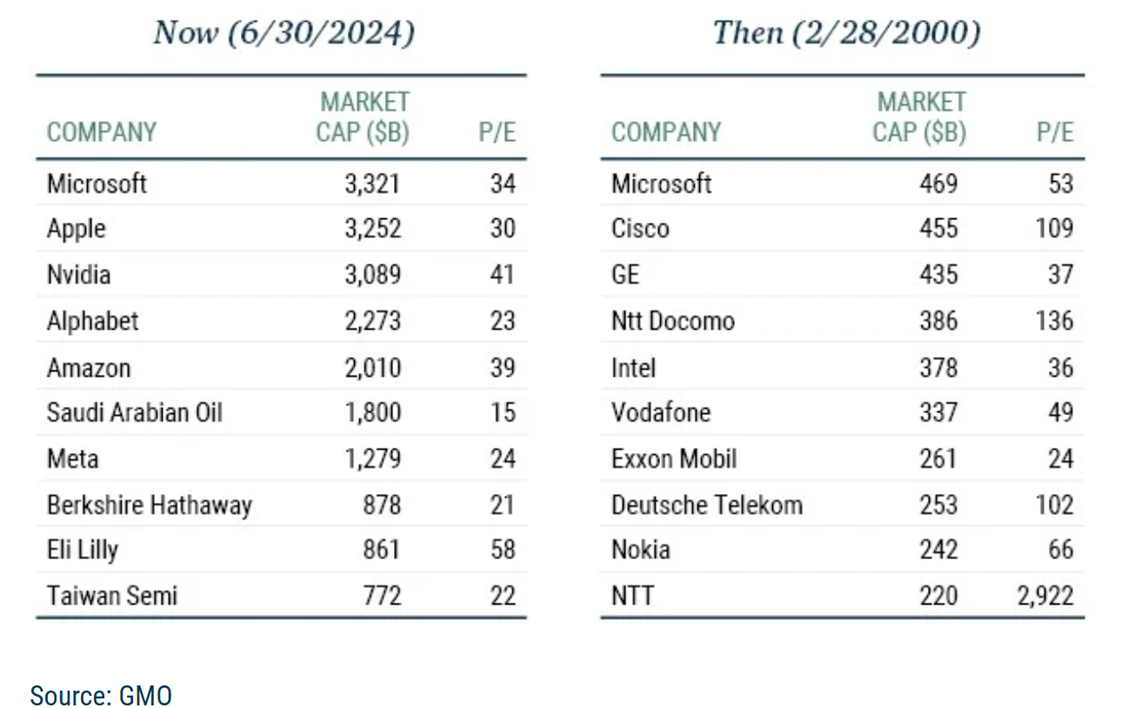
A short - and timely - paper from the team at GMO has just been published comparing the current 10 largest companies globally with the top 10 largest companies in 2000 from a fundamental perspective:

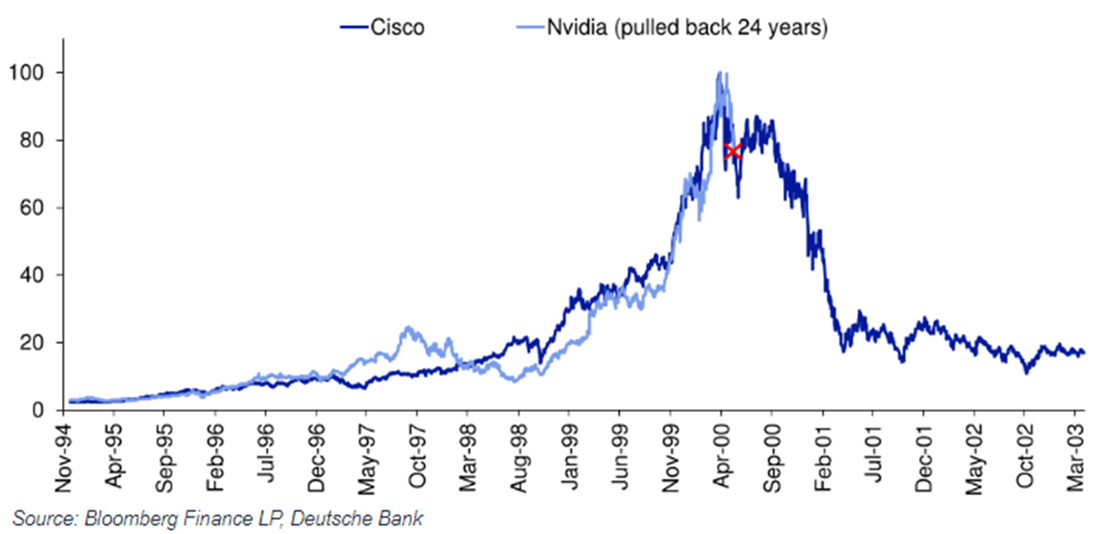
Looking at club membership, parallels can be drawn between the influence of today’s AI arms race and the TMT mania that gripped investors 24 years ago, highlighted by this NDVA & CSCO analogue currently doing the rounds:

Snippets
The top 10 largest companies globally:
• Trade on a median P/E of 27x today vs 60x in 2000
• Are forecasted to achieve 19% earnings growth for next 5Y. Should they deliver, (and market prices remain static), this implies 12x P/E by 2029. In 2000, 19% earnings growth, if achieved (it wasn’t), implied 25x P/E by 2005
• Maintain a level, and stability, of profitability + balance sheet strength today that places the group in the top 10th percentile. In 2000, the group of companies placed in the 50th percentile
Caveat: none of this is determinative in predicting the path ahead for stock prices. The evolving composition of today’s top 10 will depend enormously on how quickly AI monetization unfolds given the magnitude of capital investment taking place.
Comfort for investors until this point has been the ability of MGC (mega cap growth companies) to efficiently, and effectively, allocate capital.
Questions are currently being asked by nervous investors as to whether this will remain the case, triggered by disappointing results from big tech relative to lofty expectations.
This trend comes at a time of a rapidly shifting investment landscape that includes central bank decision surprises, a huge carry trade unwinds in the Japanese yen, the re-emergence of recession fears in America, and a significant ramp up in Middle East geopolitical tensions.
It is likely that the trend of the past 18 months, namely that NVDA’s earnings results, and guidance, currently scheduled for late August, will be amongst the most hotly anticipated in corporate history.
(Cover Image Source: Ramón Salinero)