TEAM 1st Quarter 2026 Investment Review & 2nd Quarter Outlook 2026
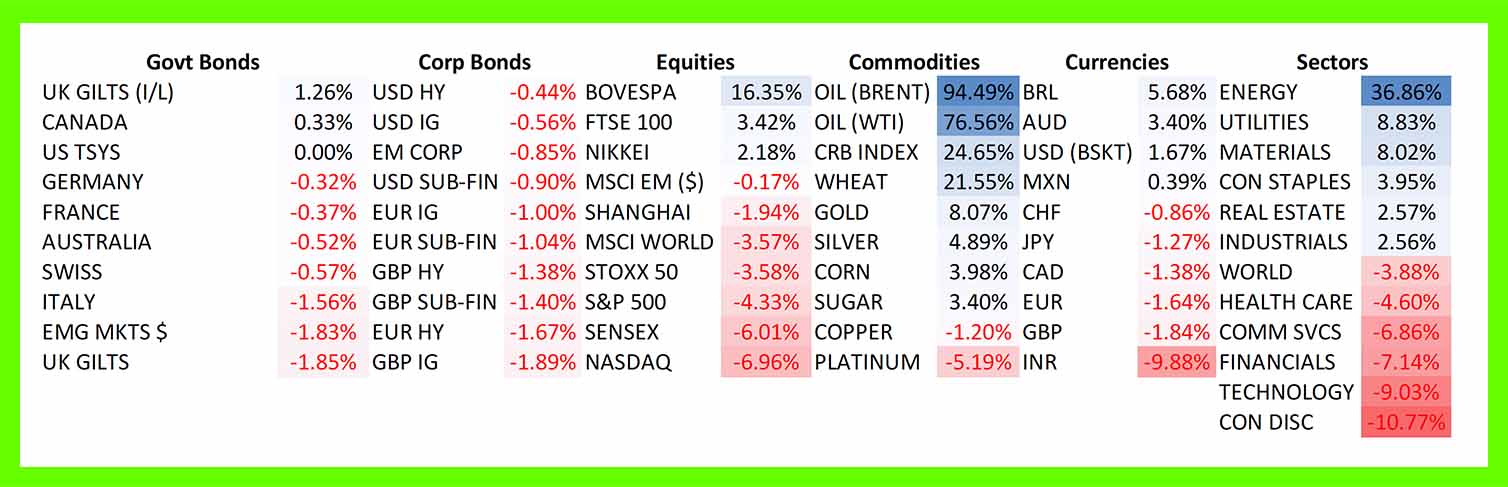
Major Asset Class Returns for 1st Quarter 2026, GBP (£) terms
Investment Review 1st Quarter 2026
Poking the Hornet’s Nest…Again
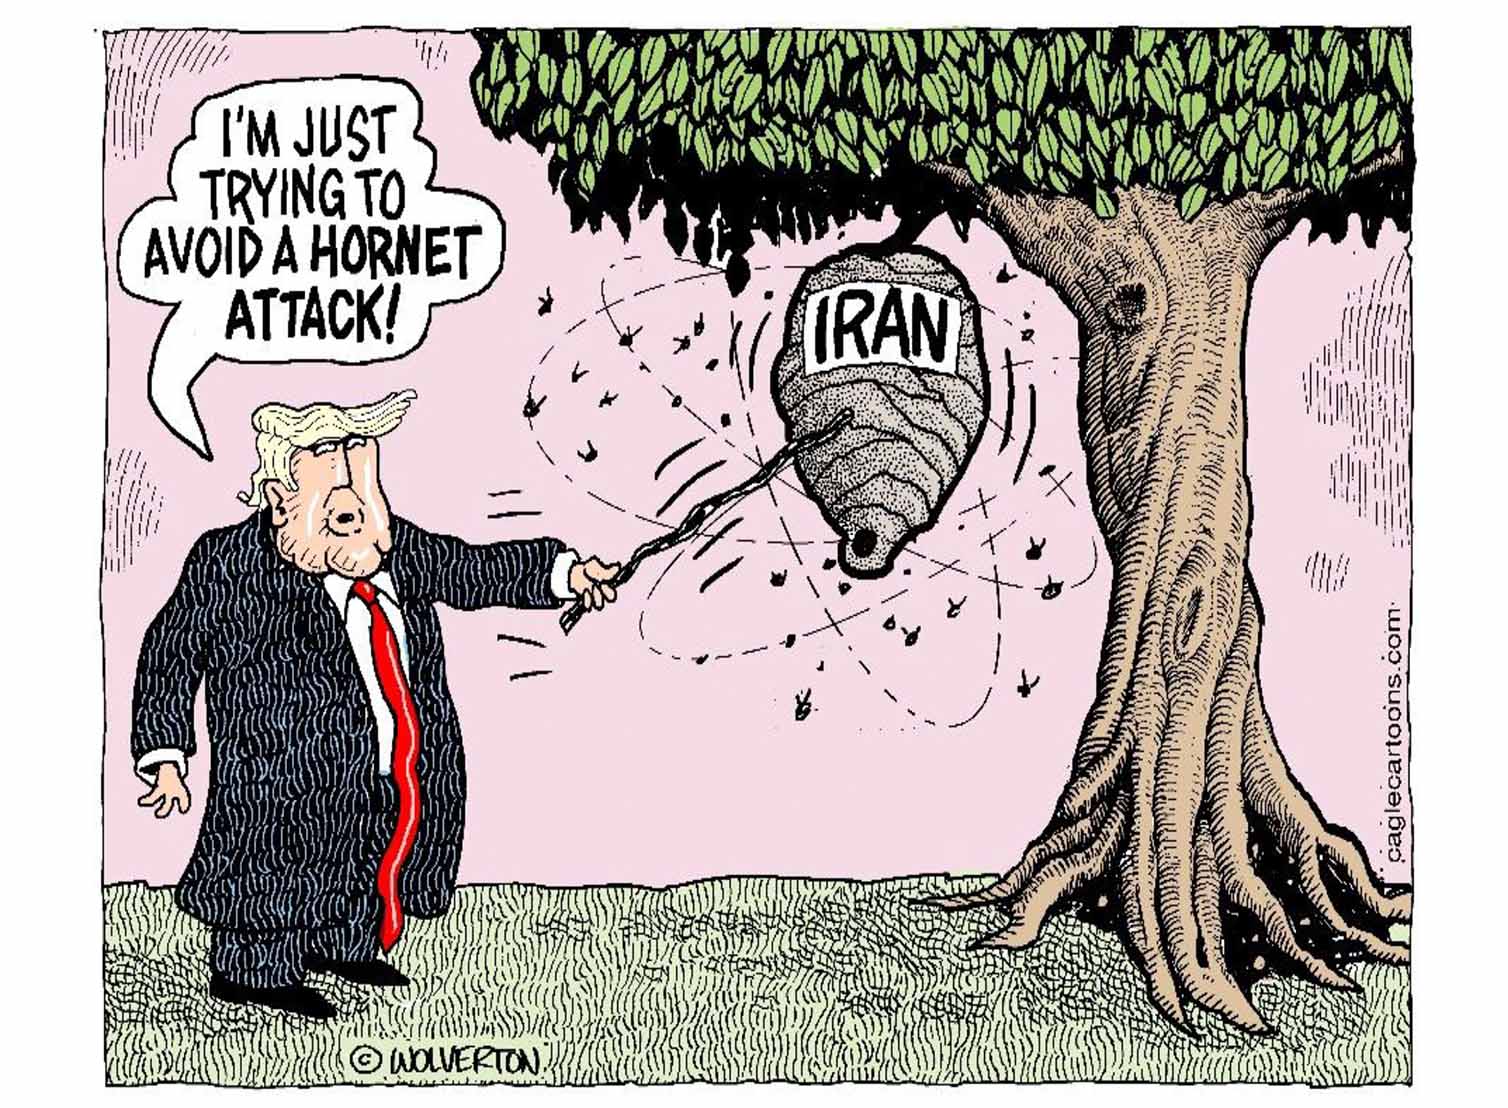
(Image credit: Monte Wolverton, Cagle Cartoons, The Week, January 2020)
The relative calm that had permeated the global investment landscape for much of the past twelve months was violently upended as US Central Command commenced Operation Epic Fury against Iran on 28 February.
Financial markets suddenly found themselves cloaked in the ‘fog of war’, a term that originated from the writings of Prussian military theorist Carl von Clausevitz nearly 200 years ago. It refers to heightened confusion and a state of temporary blindness brought about by the stress, speed, and the spread of misinformation experienced during a conflict.
The already difficult task of appropriately pricing assets and risk real-time was made harder still by American and Israeli leadership pursuing diverse strategic objectives, a slew of contradictory public statements from decision makers inside the US administration, and the unwillingness of NATO members to commit military support in the region.
Flipflopping Donald
A flipflopping American President Trump was often the protagonist, utilising Truth Social, his preferred medium of exchange, to indicate that the US was close to meeting its war objectives only to post highly charged, vitriolic, threats to the Iranian leadership less than twenty-four hours later.
Much to the Donald’s chagrin, Iran’s regime refused to capitulate despite suffering catastrophic personnel and organisational losses, including the dismantling of the top tier of its religious, political, and military command. The remaining Iranian leadership also played its own trump card by functionally closing the narrow, 21-mile passage known as the Strait of Hormuz, halting nearly all maritime traffic and triggering a massive global energy crisis.
Dire Strait
As the world’s most critical oil and fertiliser chokepoint, the Strait’s importance cannot be understated: approximately 20% of the world’s oil and 25% of seaborne oil pass through daily (an estimated 20 million barrels), in addition to c.30-50% of global fertiliser exports, essential inputs for food staples including wheat, rice, and maize.
Approaching quarter-end, and with no clear path to a full reopening of the Strait of Hormuz in sight, markets became increasingly jittery. An orderly correction descended into a more serious ‘risk-off’ event as investors began to reprice greater odds of higher-for-longer inflation, the growing prospect of central bank hikes (including the ECB, BoE, and Federal Reserve) and a material global growth slowdown. This so-called ‘uncertainty premium’ was hastily applied to all assets outside of cash.
More TACO’s
Global stock market losses would surely have been more acute were it not for Mr Market’s prevailing view that Trump would ‘TACO’, an acronym introduced by Financial Times columnist Robert Armstrong to describe the market theory that the Donald often reverses, or softens, threats after causing market turmoil.
The ‘TACO’ trade played out several times during tense March negotiations between the US MAGA (‘Make America Great Again’) administration and the surviving Iranian leadership:
On March 21, Trump issued a 48-hour ultimatum, threatening to ‘obliterate’ Iranian power plants if the Strait of Hormuz was not reopened, before announcing a 5-day grace period with hours remining, citing ‘very good and productive conversations.’
As the second deadline approached on March 26, Trump extended it once again, this time until April 6, to allow for continued negotiations in Geneva.
Finally, stocks surged on the final trading day of the quarter after Trump suggested that the war could end ‘within two to three weeks’, citing potential concessions from Iranian President Masoud Pezeshkian. Invariably, there was little hard evidence to substantiate the claim, nor verification from the Iranian side.
Equities: Scores on the Doors (all returns in sterling terms)
Developed market equities (represented by the MSCI World Equity Index) delivered a -3.6% total return over the 1st quarter. The S&P 500 large cap index returned -4.3% whilst the technology-laden Nasdaq Index, powered by mega cap growth stocks and all things AI, delivered -7%.
Japan’s Nikkei 225 Index finished the quarter with a return of +2.2%, a headline move that masks a quarter of ‘two halves.’ The key political development was Sanae Takaichi’s historic landslide victory in the Lower House election held in February as the ruling LDP (Liberal Democratic Party) secured a two-thirds supermajority, winning 316 of 465 available seats.
That was overshadowed somewhat by the ongoing hot war in the Middle East. Japan, a resource-poor island nation, remains exceptionally vulnerable to an effective Strait of Hormuz closure, given that the country imports almost 90% its energy resources. A weak domestic currency has compounded the issue, making essential fuel imports significantly more expensive.
The MSCI Emerging Markets Index finished broadly flat, although there were divergences in terms of the returns of individual countries. Commodity-heavy Brazil was the standout performer, benefitting from perceived haven status as a net oil exporter and growing expectations of interest rate cuts, a marked contrast from the developing situation across many of the G7 economies (Canada, France, Germany, Italy, Japan, United Kingdom, united states).
China’s Shanghai Index returned -1.9% as investors largely ignore growing positive macro dynamics including a record trade surplus (reflecting the country’s dominance in global manufacturing) and a related ongoing boom in intra-emerging market trade (which now accounts for a bigger percentage share than developed markets).
Fixed Interest
After starting the year on the front foot as the disinflationary trend continued, European government bonds reversed sharply in March and yields climbed to their highest levels in at least 15 years, reflecting expectations of higher interest rates.
Higer yields not only reflect higher interest rate expectations but the hit to public finances from higher borrowing costs and measures to protect consumers and businesses from rising energy prices:
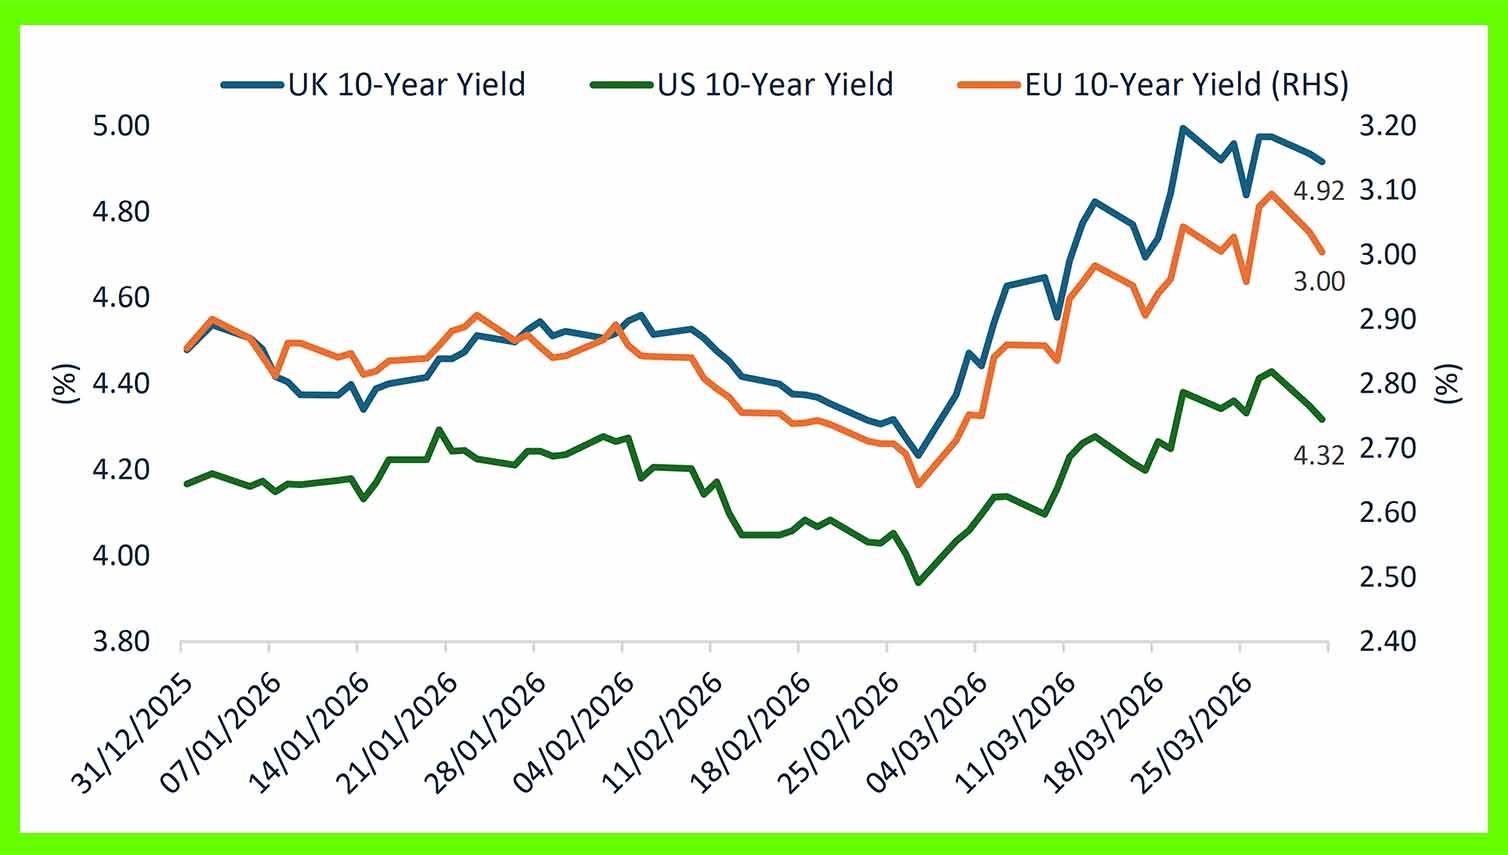
(Source: Bloomberg, TEAM)
Acknowledging the urgency of the issue, Spanish lawmakers approved a EUR 5 billion package of tax cuts designed to soften the blow of higher energy prices by reducing VAT from 21% to 10% on electricity, natural gas and fuels. Italy has also temporarily cut fuel excise duties by 20%, a measure that will cost EUR 417 million until 7 April, when it will be reviewed.
France has also introduced measures to support industries most exposed to the spike in energy prices, putting its latest minority government’s optimistic target to reduce the budget deficit to 5% of GDP by the end of 2026 in serious jeopardy.
However, European governments do not have the fiscal space to repeat the fuel subsidies of 2022 and 2023 due to the competing priorities of deficit reduction and commitments to increase spending on defence and security.
Against this backdrop, governments with the strongest balance sheets have attracted more haven inflows amid the market turbulence and the trend of peripheral European government bond yields converging toward Germany reversed sharply in March. The spread between 10-year Italian and German government bonds has widened by around 30 basis points since the start of the conflict.
ECB
The prospect of an inflation shock has triggered an unprecedented swing in interest rate expectations in the space of a month. At end of February, money markets were pricing in a 50% chance of another rate cut by the European Central Bank this year, however, at the time of writing, two or three hikes are now expected:
(Source: Bloomberg, TEAM)
However, President Lagarde asserted that the ECB’s commitment to delivering 2% inflation over the medium-term is ‘unconditional’ and it stands prepared to act if necessary. Whilst central banks cannot bring energy prices down with tighter monetary policy, they can mitigate the risk of its spilling over into broad-based inflation and second round effects via wages and inflation expectations.
Mme Lagarde also acknowledged that the Eurozone economy should be more resilient to the 2022 energy price shock as back then, the economy was primed for pass-through owing to pent-up demand from the Covid-19 pandemic lockdowns, widespread supply chain disruptions and labour shortages.
The preliminary inflation report for March estimated that annual Eurozone inflation jumped to 2.5%, the highest level in nearly two years, and the biggest monthly increase (0.6%) since late 2022.
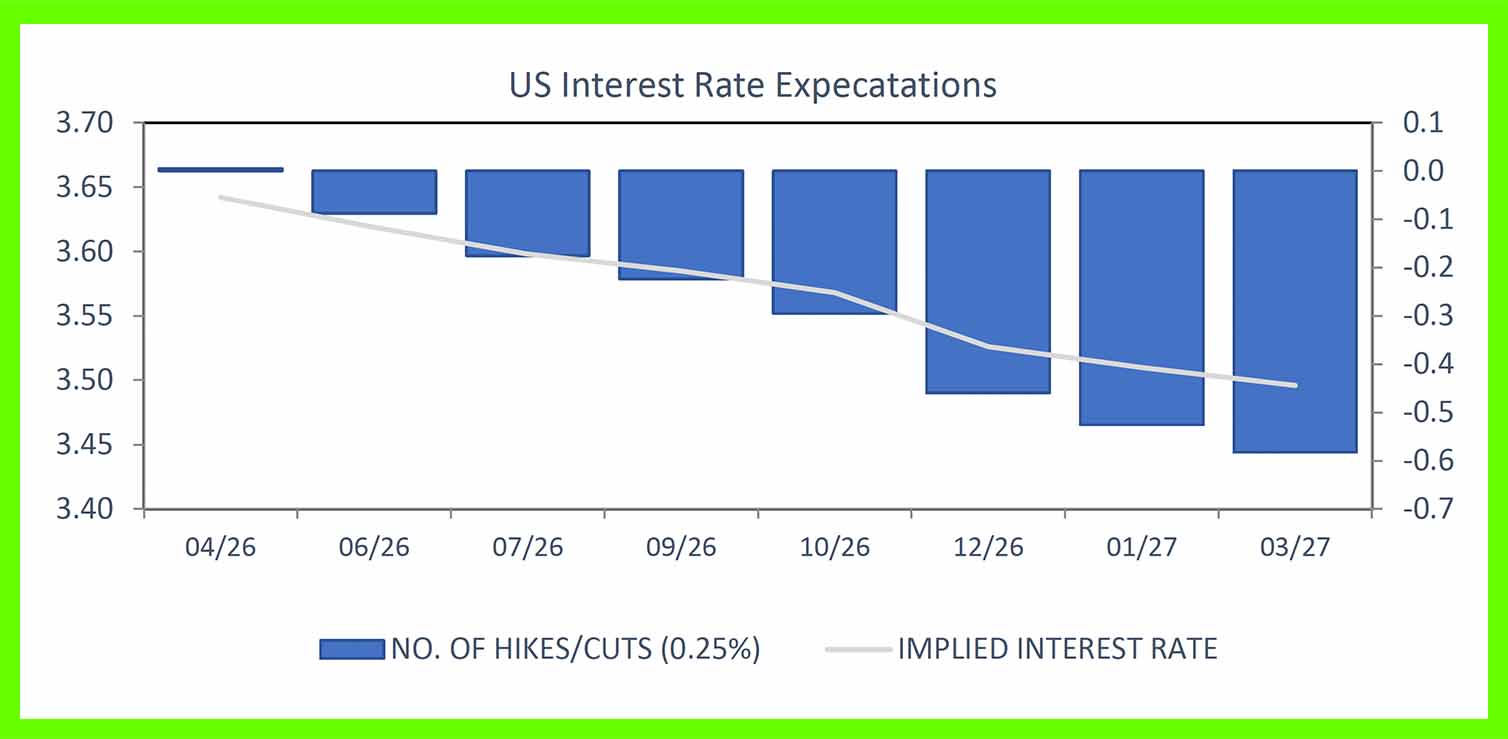
Federal Reserve
There has been a more muted shift in interest rate expectations across the Atlantic reflecting the Federal Reserve’s dual mandate to achieve maximum employment and price stability, and the US’s energy security:
(Source: Bloomberg, TEAM)
Economic risks were already building prior to the war, highlighted by the weakening jobs market. The nonfarm payrolls report for February revealed that US employers cut 92,000 jobs in February, the third time in five months that payrolls declined.
Even with inflation risks rising in the US, money markets still expect the Fed to cut rates this year. The deep split on the FOMC, and the expected appointment of Kevin Warsh to replace Jerome Powell, however, makes any predictions more hazardous. Warsh has been a long-term advocate for shrinking the Fed’s balance sheet, but he is also firm believer in an AI-driven productivity boom that might allow for a more accommodative interest rate policy.
BOE
Closer to home, the quarter began with the Bank of England holding its base rate steady at 3.75% in February, with the vote split 5 to 4. Remarkably, four members wanted to cut to 3.5%. The mood at that point was cautiously optimistic: inflation had been falling steadily, and the Bank expected it to reach the 2% target by April. Further gradual cuts through the year seemed probable.
Operation Epic Fury changed the picture overnight. Surging energy prices, and acknowledgment of the swift impact to households and businesses, pushed the Bank's inflation forecast sharply higher. By the time of the March meeting, the Bank held rates again but now expect inflation to hover between 3% and 3.5% for much of the year, far above where it had anticipated just weeks earlier.
The Bank was candid about the bind it now faces. Higher energy costs push inflation up, but they also squeeze household budgets and slow the economy down, leaving policymakers pulled in two directions at once. Several members flagged the risk that if businesses and workers start expecting prolonged inflation, it could become self-fulfilling through higher wages and prices.
In short, what looked like a clear path to lower rates at the start of the year has become far murkier. Markets shifted from pricing in multiple cuts to (briefly) entertaining the possibility of a hike. The next decision is due 30 April:
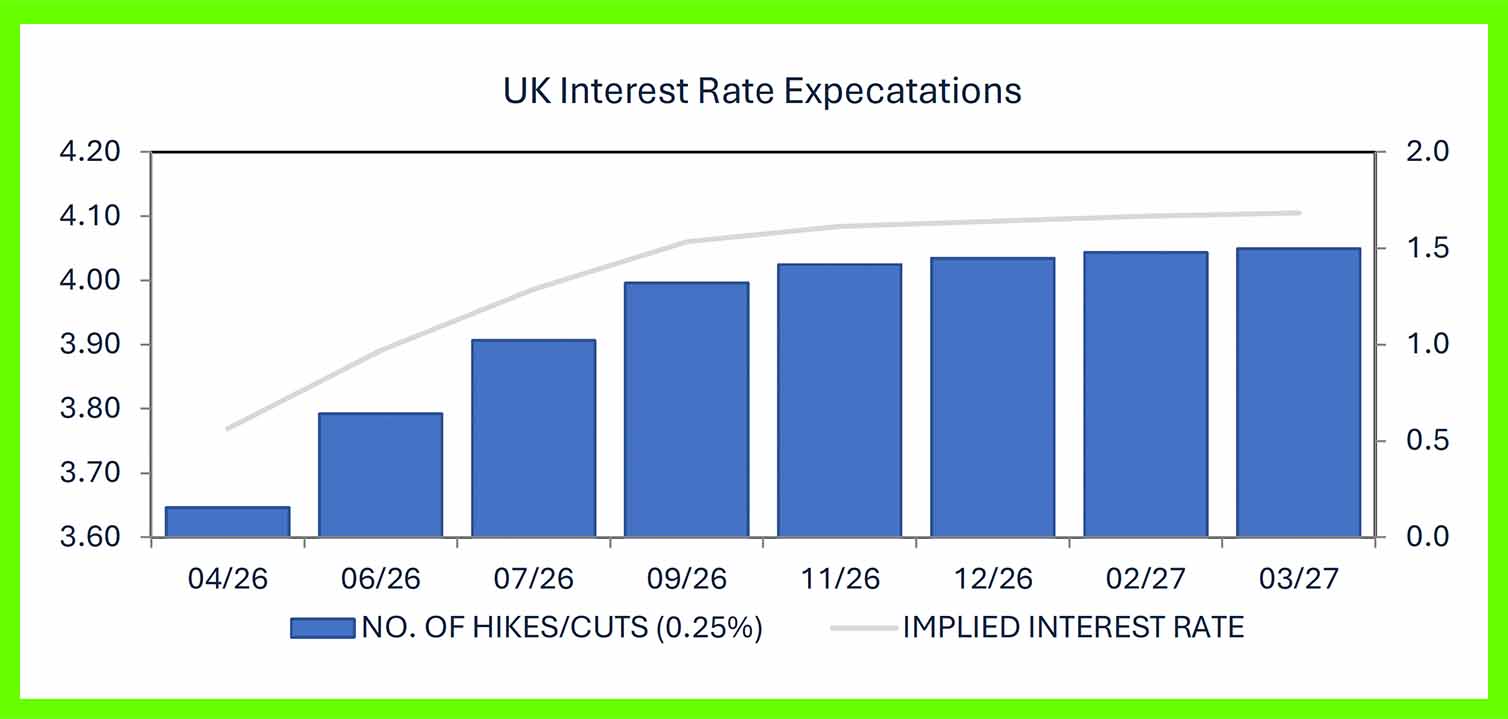
(Source: Bloomberg, TEAM)
Commodities
Commodities once again stole the show, albeit for very different reasons this quarter (3-month percentage return shown below):
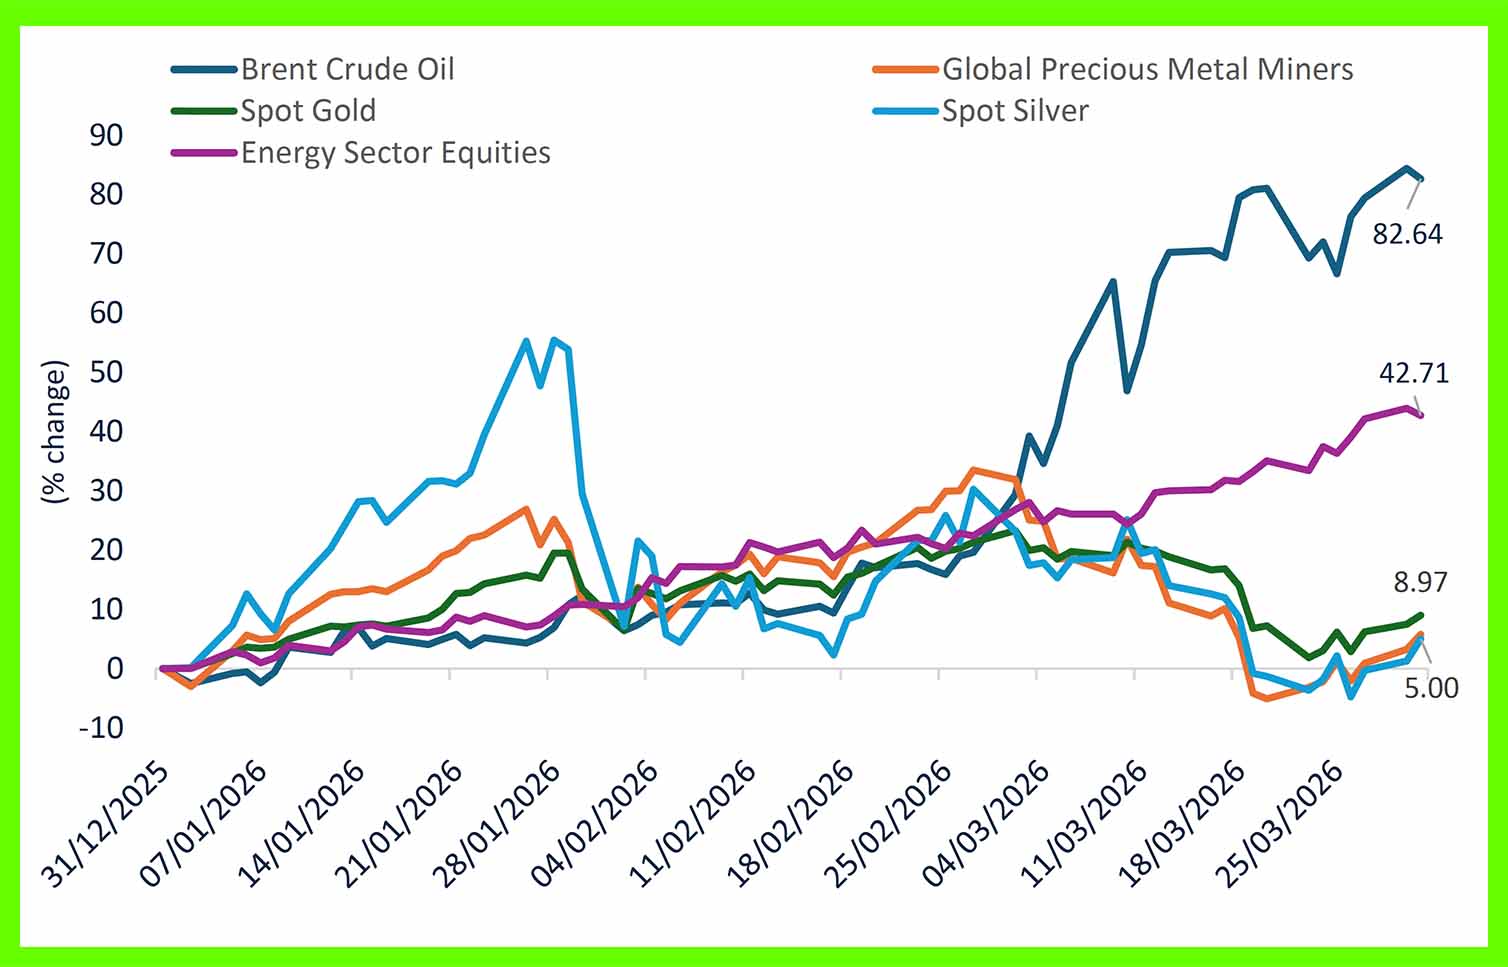
(Source: Bloomberg, TEAM)
Oil and energy prices
The quarter began calmly, with Brent crude trading in a narrow range of between $60 and $70 a barrel for most of January and February. Operation Epic Fury flipped the script, with the effective closure (to perceived enemies, not allies, of Iran) of the Strait of Hormuz triggering a rapid oil price surge higher.
Brent broke through $100 a barrel by 8 March and peaked near $128, swinging wildly on ceasefire rumours and mixed signals from Washington. European natural gas prices nearly doubled within 48 hours before partially retreating. Oil ended the quarter up approximately 83%, a staggering move.
Gold & Silver
Gold began this year in fine fettle, setting an all-time high of $5,589 per ounce on 28 January. The key catalysts have been ever-present in this post pandemic market cycle: structural dollar weakness as countries seek to diversify out of US Treasuries and ‘King Dollar’, a frequent flaring in geopolitical tensions across the globe, and the belated entrance of ‘Joe Public’ retail investor, who began to express significant ETF buying interest late last year.
All found a proverbial ‘air-pocket’ with the Donald greenlighting Operation Epic Fury. Gold initially rallied but swiftly lost its shine amidst a range of fundamental (Persian Gulf central banks suddenly cash-strapped and unable to buy the yellow metal, bond yields soaring providing an attractive alternative investment) and technical (leveraged ETF exposure unwind, investors selling their portfolio winners) factors.
Silver had a similarly turbulent ride. It briefly spiked above $96 per ounce when the conflict erupted before reversing sharply as equities fell and investors sold everything liquid (and profitable) to raise cash. Silver's dual role: part precious metal, part industrial commodity, made it particularly susceptible to fears of an economic slowdown dampening industrial demand.
Precious Metals Mining Stocks
Whilst elevated spot gold and silver prices remain high by historical standards, surging, and elevated, energy costs raised concerns about a squeeze on miners' profit margins. After an exceptional run of gains leading into the quarter, a basket of leading precious metals miners hit an all-time high in early March, before a sharp correction ensued. Major miners including Newmont and Barrick Gold were forced to revise production guidance downward.
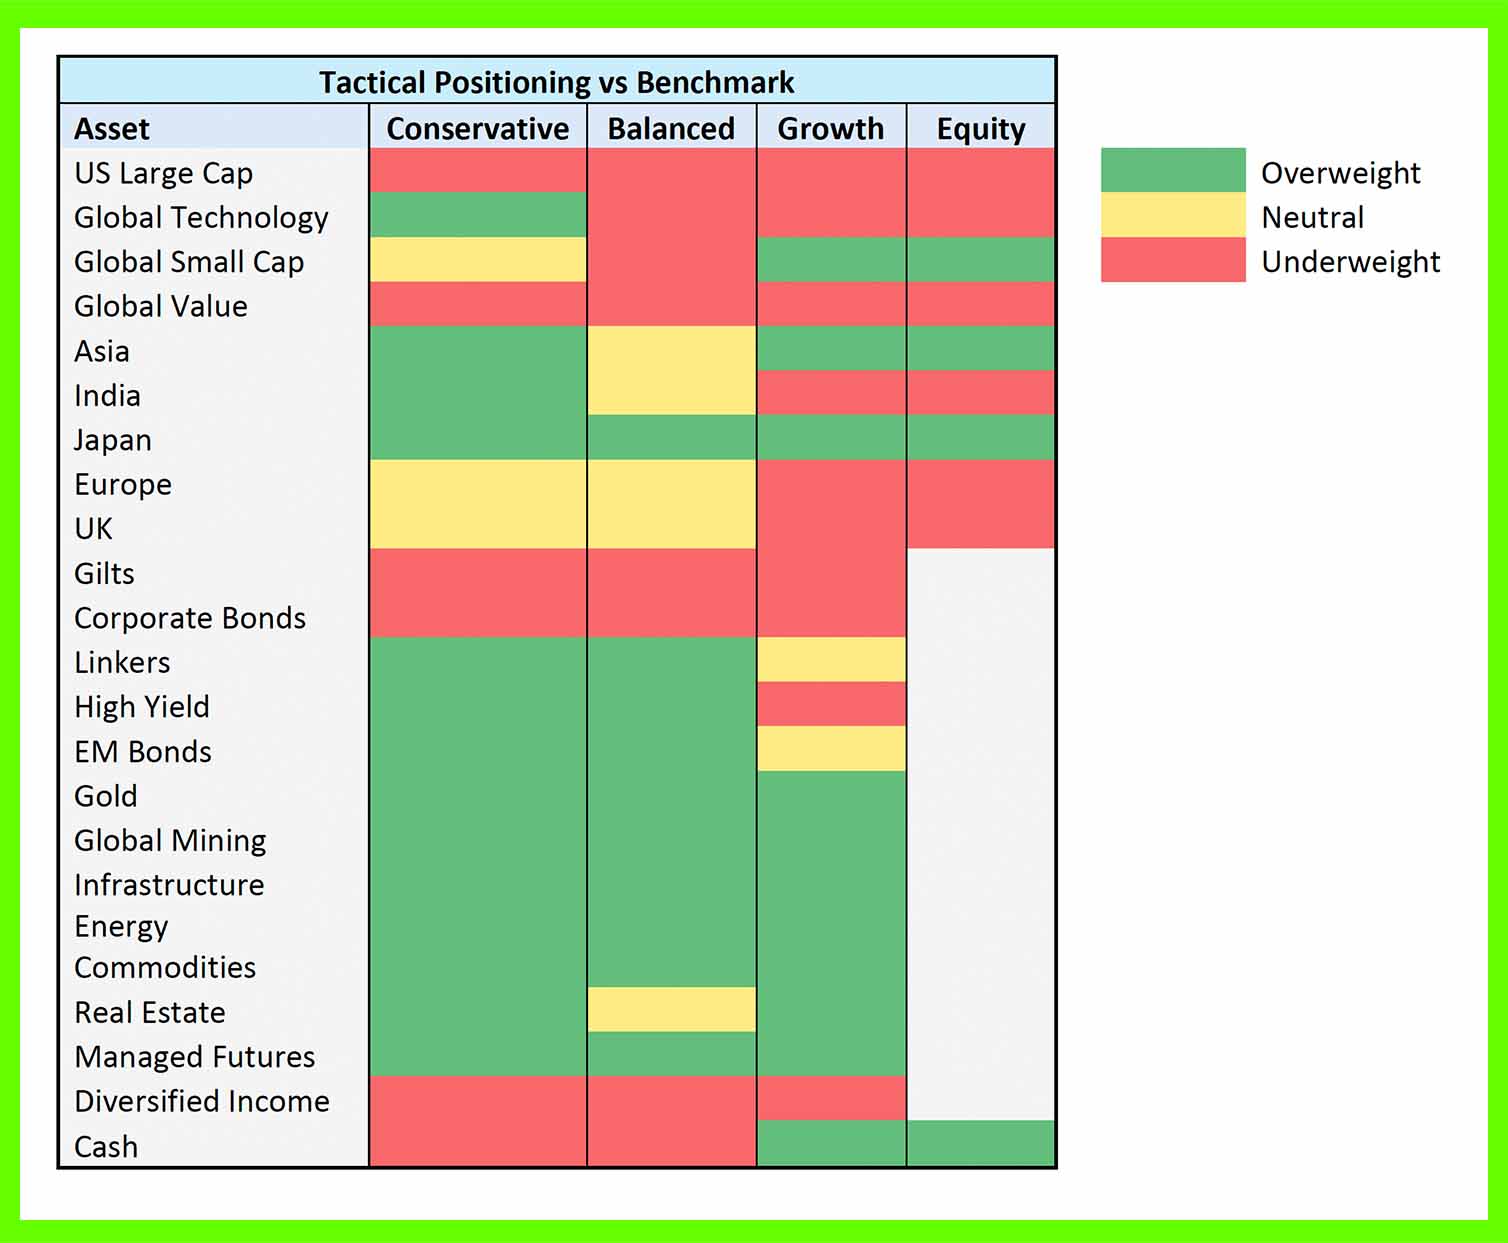
TEAM Positioning & 2nd Quarter 2026 Outlook
What worked during Q1 2026: Oil and leading energy sector companies ETF exposure, cash, developed market property exposure, ultra short, fixed income exposure.
What did not work during Q1 2026: physical gold, physical silver, precious metal mining stocks, equities domiciled in countries hypersensitive to a surging oil price including Japan, the UK, Europe, and selective emerging markets.
As we enter Q2 2026, our asset allocation for the core TEAM MPS multi asset range and equity strategy is shown relative to neutral weightings in the table below:
Equities: calm or complacent?
One of the oldest axioms in investing is that Mr Market hates uncertainty. Yet, against the backdrop of arguably the greatest potential oil and gas disruption in history, markets have broadly behaved themselves.
Yes, risk assets, led by equity markets, have corrected, but not significantly. The prevailing narrative seems to be hanging its hat on three factors. First, that corporate earnings remain in decent shape, and that is ultimately what investors care about. And second, that the Middle East conflict will conclude any day soon, as it is in the interests of both the US and Iran to find an ‘off-ramp’ and move towards de-escalation.
From an investment building blocks perspective (Macro, Sentiment, Technical, Valuation), the sell-off YTD has led to some proverbial ‘green shoots’ appearing. We are not suggesting an important low is ‘in’, but, like a rubber band that has been fully extended, a short, sharp snap-back in the opposite direction, in this case to the upside, becomes a growing possibility.
Macro: 2025 federal tax receipts, in our humble opinion the best barometer of US economic growth, were up more than +10% year-on-year. During the first quarter, aggregate tax receipts were +4% year-on-year.
This does not reek of a sharply slowing economy. Expect the Trump administration to continue with unconventional monetary and fiscal policies in a not-so-subtle vote winning effort through the course of this year. If America can side-step a recession in 2026, odds of positive equity return twelve months out from here greatly improve.
Valuation: Whilst it cannot be argued that US markets are cheap, many international markets have returned to attractive prices in an absolute and relative context.
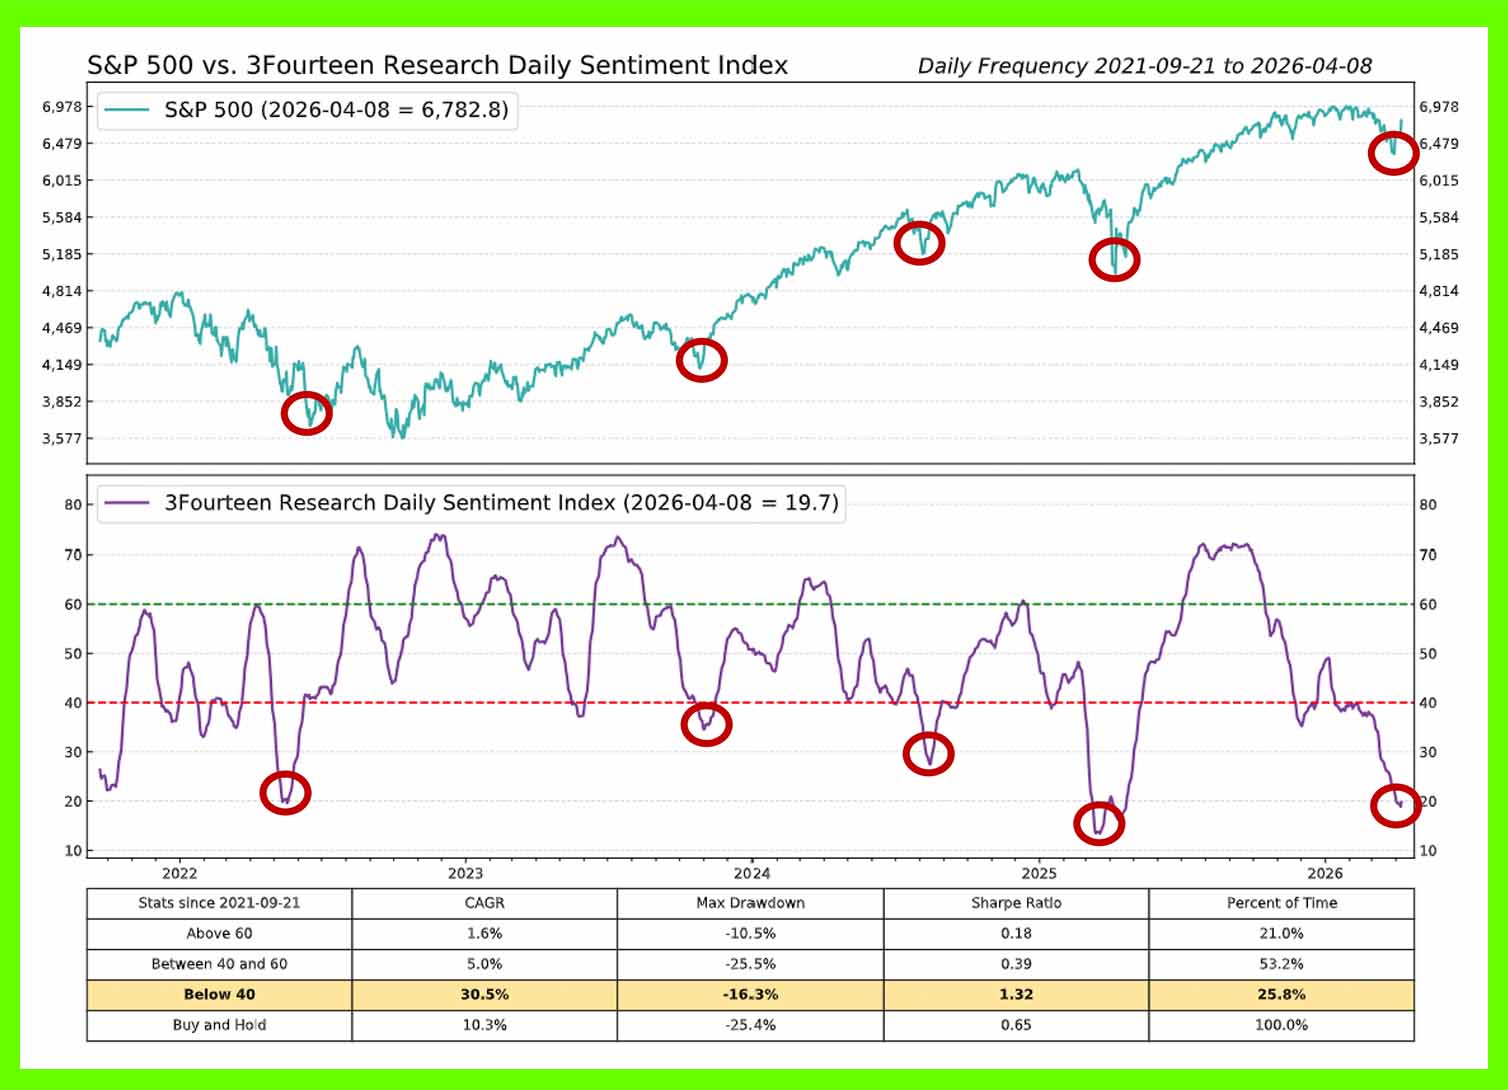
Sentiment, as measured by the CNN Greed and Fear gauge hit a ‘9’ reading, indicating extreme fear, whilst the 3Fourteen Daily Sentiment Index, shown below, currently read ‘22’ at quarter-end. Both measures are closing in on levels typically associated with capitulation lows:
Technical: Retail inverse (‘short’) ETF buying as a percentage of overall ETF buying has hit the ‘50’ level, suggesting Joe Public is screaming to buy house insurance after the family home has caught fire. From a contrarian perspective, we are approaching an area that points to greatly improved odds of positive equity return twelve months out from here.
Fixed interest
The longer the uncertainty regarding the conflict in the Middle East, the higher likelihood of more pressure on steeper yield curves and wider credit spreads, reflecting the higher risks of inflation and growth shocks. However, a near-term ceasefire or US withdrawal should lead to rates led gains.
The conflict has already caused some significant damage to energy infrastructure across the Middle East, including missile strikes on Qatar’s Ras Laffan LNG hub which have knocked out around one-fifth of the country’s energy capacity. It will take years to restore infrastructure and even if the Strait of Hormuz reopens, energy prices are unlikely to fall back to pre-war levels any time soon. This is unequivocally bad news for inflation, potentially worse news for interest rates.
Liquid Alternatives
Trump’s actions in the Persian Gulf are likely to reverberate across the Middle East and beyond for years to come.
Operation Epic Fury was seemingly initiated without consulting allies in the region. Worse still, the retaliatory drone and missile attacks waged by Iran on ‘American allies’ included high profile targets across Dubai, Kuwait, Qatar, and Saudi Arabia that threaten to unravel decades of soft power progress.
Wealthy Arab monarchies have spent decades and trillions of dollars transforming their countries into global hubs for business, tourism, and air travel. Once the dust has finally settled on this catastrophic episode, the region’s leaders will likely be reassessing alliances with the US and step-up efforts to diversify their future security.
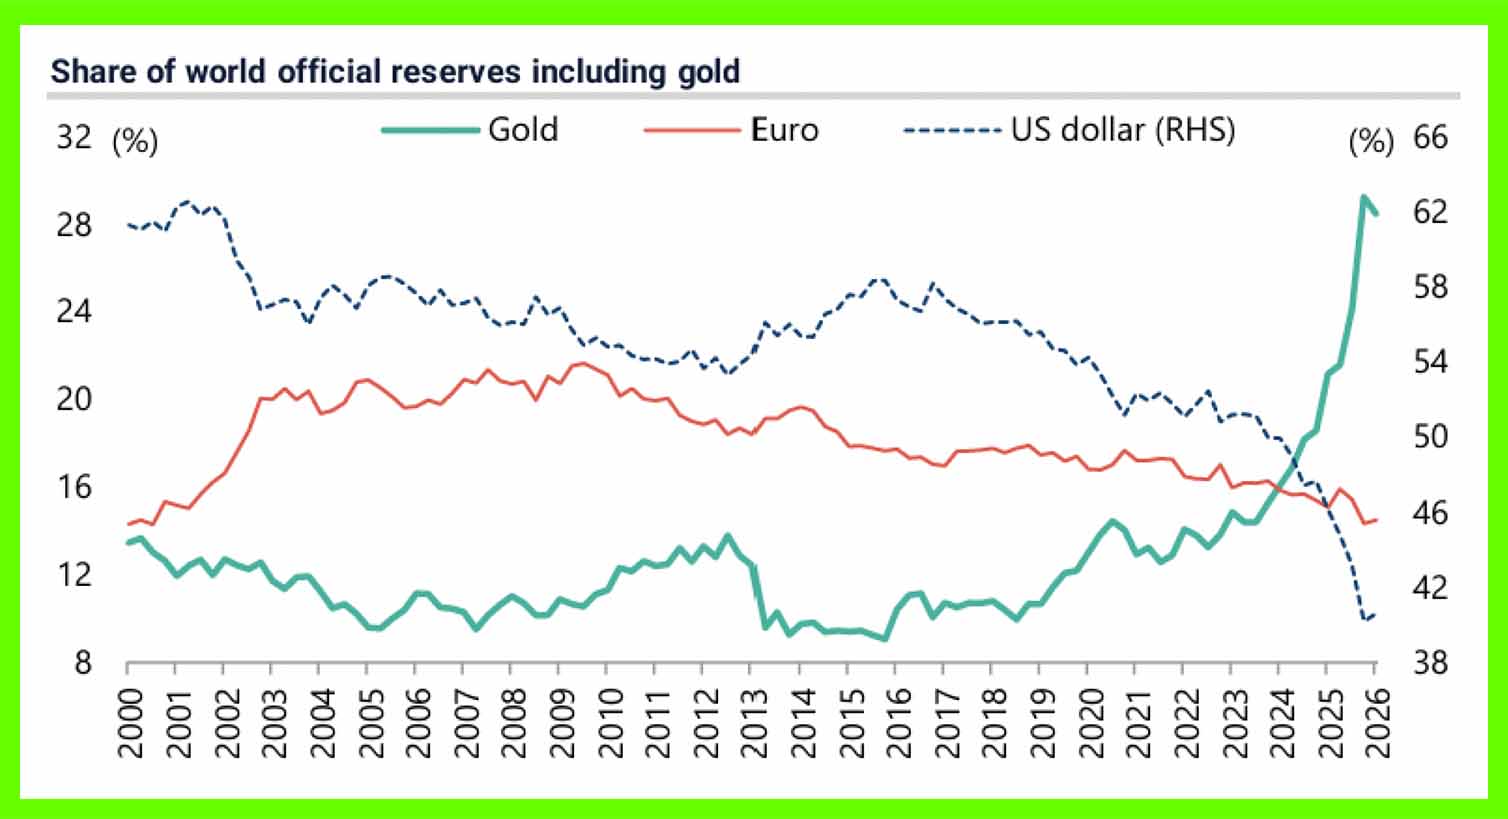
Against that backdrop, the continuing case for owning physical gold over the US dollar and US Treasuries would appear to have only strengthened. It is worth noting that gold’s share of central banks’ foreign exchange reserves has already approached the 30% mark, according to data from the World Gold Council and the IMF (International Monetary Fund). The chart below is courtesy of Jefferies Global Research:
Domestically, the incumbent US government finds itself locked in a proverbial straitjacket regarding public finances. The brutal reality facing the US government is that approximately 92% of existing US interest payments are directed to Medicare, Medicaid, and Social Security, which are essentially ‘untouchable’.
The fact that the enormous US debt mountain continues to grow despite record US tariff revenue collection in 2025 (albeit this initiative has since been declared ‘illegal’ by the Supreme Court) and federal government tax collection running at almost a 10% annualised rate speaks to the enormity of the challenge. Almost another 550 billion dollars, or $6-8 billion per day, was added to the national debt over the prior quarter:
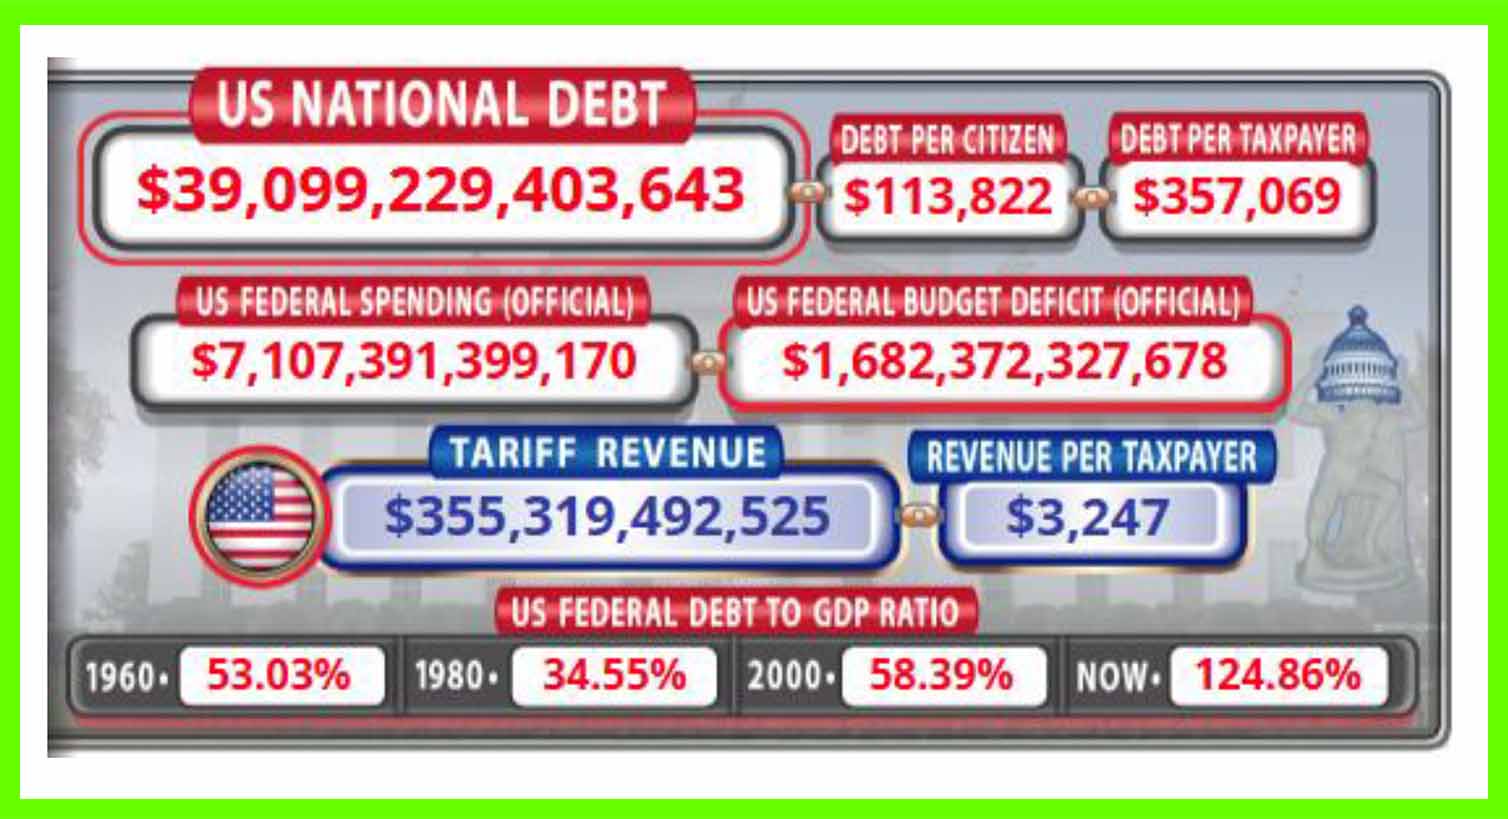
(Source: USdebtclock.org)
With politicians across G7 unwilling, and/or unable to make the tough choices required to address the growing global debt binge, owning real assets with no meaningful way to increase supply in the short term would seem to be a sensible approach. That extends to silver, and leading precious metal mining companies that are geared to higher longer-term spot prices.
Positioning into Q2 2026
There are known knowns; there are things we know we know. We also know there are known unknowns; that is to say we know there are some things we do not know. But there are also unknown unknowns, the ones we don't know we don't know.
(US Secretary of Defence Donald Rumsfeld, Department of Defence briefing, 12 February 2002)
Heading into April, ‘good defence’ remains the order of the day. In Rumsfeld speak, the list of known unknowns is long. Whilst both the United States and Iran have strong reasons to call a halt to the war, obstacles to success include a total absence of trust between the two governments, no obvious common ground, and the wildcard that is Netanyahu’s Israel, which remains a clear and present threat to proceedings.
Consequently, we hold healthy levels of cash and cash proxies (a blend of absolute return funds that are designed to generate positive returns in all conditions and money market instruments) for lower and medium risk clients.
In fixed income, we firmly favour a mix of ultra short government bonds (given the uncertainty of the conflict and the growing G7 government debt problem) and good quality investment grade credits, focussed on the ‘belly’ of the curve, which are less exposed to any volatility in long-term rates but can also take advantage of steeper credit curves.
Our liquid alternatives sleeve remains a key differentiator versus benchmark and peer group. Here, our investment framework is detecting increasingly powerful price trends across the commodities space as real assets become increasingly more attractive against a backdrop of growing global demand and supply shortages.
Consequently, we enter the second quarter with direct exposure to the oil price and soft commodity prices (including soybean, corn, cotton, wheat, and sugar) complemented by leading energy sector equites and leading global agriculture and companies. Taken together, this basket should act as an effective buffer for our strategy range, particularly against the risk of a re-escalation and/or breakdown in Middle East negotiations.
Pleasingly, despite the March drawdown, the TEAM multi asset sterling range has weathered this latest storm reasonably well, keeping our Conservative, Balanced, and Growth MPS solutions in positive return territory on a year-to-date basis.
As always, rather than attempt to look around corners and predict outcomes, we rely steadfastly on our systematic investment process, which has successfully navigated an array of market conditions during this post-pandemic cycle and delivered respectable risk-adjusted returns for our investors.
Thank you for your continued support and interest in TEAM.