A Watershed Moment
An often used financial market axiom, reputedly delivered by Mark Twain, states that ‘history doesn’t repeat itself, but it does rhyme’. Whilst the sharp gyrations and turbulence witnessed across financial markets this year are not new experiences, the sheer breadth of asset price declines is one for the history books:

(Source: Bloomberg, TEAM, denotes local currency returns)
The adjustment has been swift and painful, triggered by a significant repricing of ‘risk’ across the spectrum as loose monetary conditions and cheap credit have been supplanted by far tighter monetary conditons and more expensive credit. Conventional portfolio construction, namely the 60/40 equity and bond mix that has served investors exceptionally well for decades, has been harpooned.
Markets are currently reeling from the highest inflation levels experienced in forty years, economies hurtling towards recession, eye-watering levels of global debt, extensive lockdowns in China, a war in Ukraine, multiple energy crises and a troubling deterioration in the relationship between the world’s two major superpowers.
Few, if any, were on investors’ radar this time last year; a stark reminder of how quickly economic and geopolitical circumstances can change and affect our savings and investments.
Regarding inflation, whilst the Russian invasion of Ukraine and supply chain issues are dominating the political narrative, it is worth contemplating whether the COVID-19 global pandemic, and the extraordinary response of governments to it, represented a watershed moment, pulling the curtain down on a unique period of financial market history characterised by disinflation, ultra-low interest rates and a boom in global asset prices.
The opening act of that unique period was another crisis that manifested in Asia in July 1997. It would come to be known as the ‘Asian Contagion’, a series of spectacular currency collapses and defaults that consumed large parts of the East and SouthEast region over a tumultuous six month period.
During the next few years, it would be followed by the large-scale privatisation of the Chinese economy, which would eventually lead to China joning the World Trade Organisation in 2001.
Together, this potent mix of extremely cheap currencies (giving the region an unparalleled comparative advantage in producing low-cost goods) and a surge in the size of the working age population (putting structural downside pressure on wages), propelled Asia to the role of global manufacturer, super-charging globalisation and the advent of just-in-time supply chains.
As economies opened and integrated, the Western consumer benefited. The prices of washers, dryers, refrigerators, air conditioning units, tools, computers, consumer electronics goods including mobile phones and televisions, sporting goods, jewellery and other ‘stuff’ fell dramatically in price over the early part of the 21st century.
These dynamics, holding down inflation in the West through low-cost foreign labour and thus cheap imported goods, can be seen by plotting the secular fall in the prices of U.S durable goods (top clip):
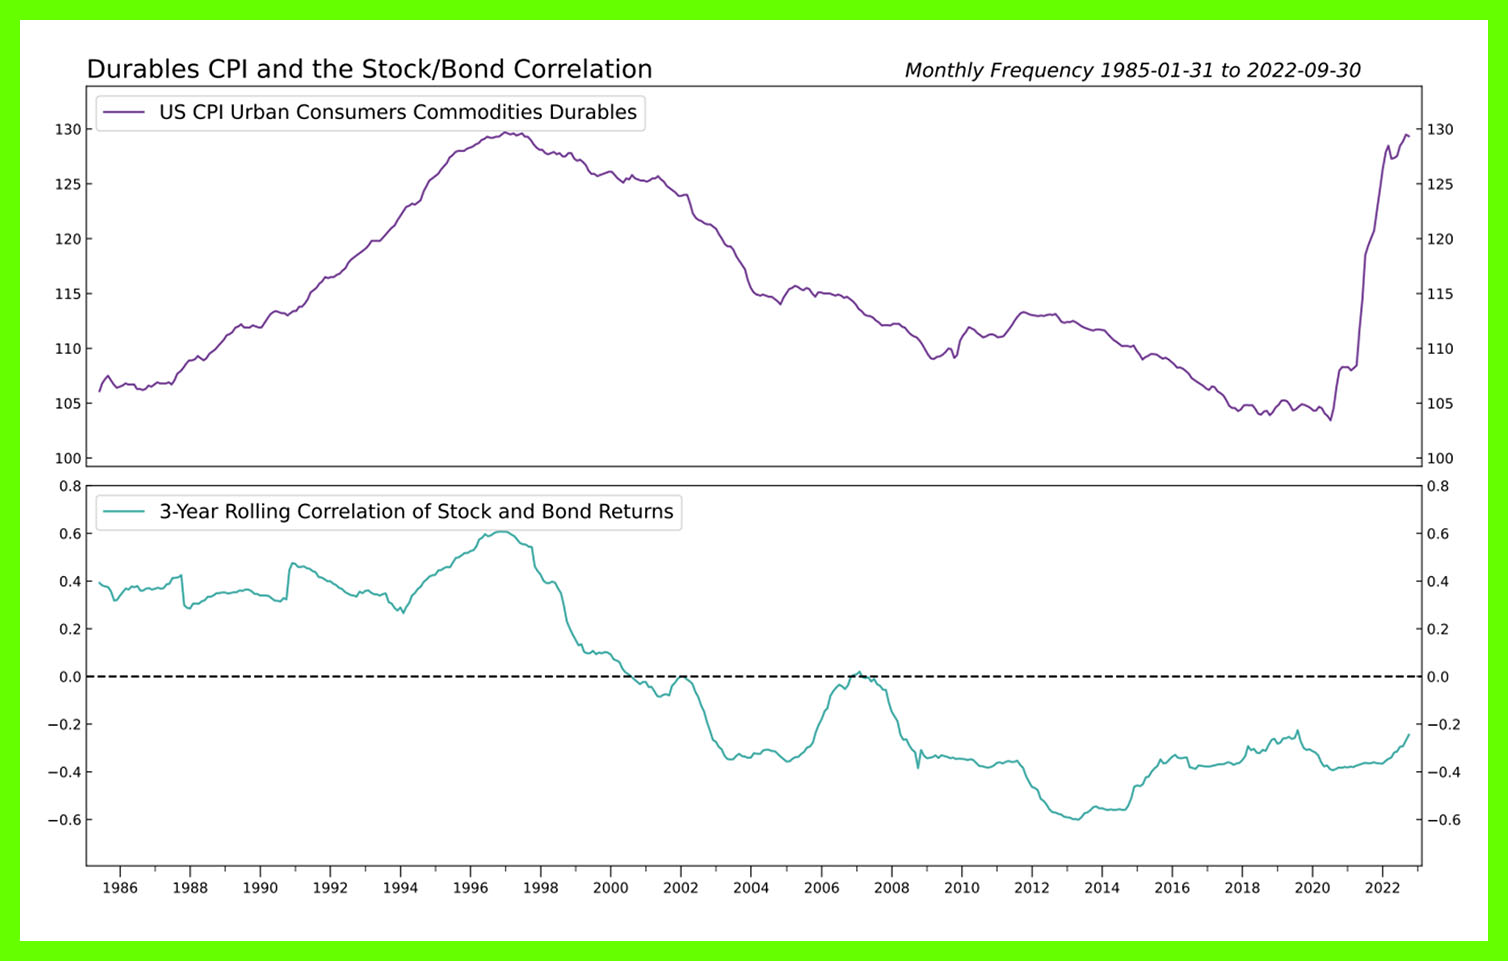
(Source: 3Fourteen Research, TEAM)
The spoils of globalisation spilled over into the fixed income markets, as the international value of currency reserves increased sharply in value. Asia’s export-led policies, led by China, generated huge current account surpluses that were recycled into U.S Treasuries and other high-quality fixed income assets as part of efforts to avoid a repeat of the crisis several years prior.
In the western world, an absence of inflationary pressures and a large marginal buyer of U.S. Treasuries drove bond yields towards zero (and into negative territory in parts of Europe), negating the need for central banks to aggressively tighten monetary policy. Absent the threat of true inflation, growth became the main factor in determining the relative price movements of bonds and stocks.
Past portfolio effect
The outcome was a near-perfect environment for the conventional portfolio construction approach we are familiar with today, namely the 60/40 stock/bond portfolio split and risk parity strategies, as the bond component cushioned the damage sustained during equity market drawdowns. An additional benefit of the bond buffer was the relatively low volatility exhibited by this asset class over the period.
Fast forward the clock to March 2020 and the coronavirus disease begins rapidly enveloping the globe, forcing extraordinary responses from governments. Emergency-enforced lockdowns severely restricted the mobility and freedom of individuals, with disastrous consequences for the world economy. The speed and magnitude of the contraction dwarfed anything experienced over the prior 73 years:

(Source: Bloomberg, TEAM)
Rather than follow the road travelled in 2008, governments paranoid about the prospect of another great recession, or worse, unleashed monetary and fiscal expansionary policies previously reserved for wartime emergencies. The proverbial money printing machine was switched back on, with vast quantitaties of debt taken onto government balance sheets as part of efforts to protect lives, preserve jobs and avoid bankruptcies.
In America, the Fed moved hurriedly to lower rates to the zero bound, whilst asset purchases and a plethora of credit and liquidity lines were introduced to prevent capital flows from gumming up. ‘Helicopter’ handouts in the form of several one-off cash payments to households and individuals were also delivered, with the combined effect of thse initiatives plainly seen in an exploding M2 money supply figure:

(Source: Federal Reserve, Jefferies Global Research)
In Europe, policymakers reached for a similar playbook, with deficit limits immediately suspended, a Pandemic Emergency Purchase Programme and a 5-year, €750 billion European Union Recovery Instrument launched by the European Central Bank to assist those hardest hit by the pandemic. Meanwhile, UK public spending efforts to tackle the pandemic cost approximately £6,000 per person, or £410 billion in total.
All told, in 2020 we observed the largest one-year debt surge since World War II, a rise of 28% of global GDP to $226 trillion. This figure jumped to $303 trillion by 2021 according to the Institute of International Finance.
The largest burst of emergency spending in history broke the grip of the deadly pandemic and spared the global economy from ruin. However, with interest rates back at the zero bound level, abundant liquidity in the system and many households much better off financially than prior to COVID, risk appeitite and investment speculation returned with vigour, reflating asset prices to extraordinary valuation levels.
Meanwhile, COVID-19 and its various mutations exposed chronic weaknesses in the concept of globalisation and just-in-time supply chains, triggering a behavioural change from governments and corporations who saw an urgent need to re-prioritise economic and energy security. In short, the winds have shifted, from the deflationary impulse of the past to a future that may well turn out to be more inflationary in nature:
The Past
- DEFLATIONARY IMPULSE
- Globalisation
- Open Trade
- Just-in-time supply chains
- One supply chain
- Restricted military spending
The Future
- IMPULSE
- Deglobalisation
- Autarky (economic system of self sufficiency, limited trade)
- Just-in-case hoarding of commodities
- Duplication of supply chains
- More military spending
(Source: suggested by Zoltan Polzsar; Money, Commodities and Bretton Woods III, Creduit Suisse)
If history is any guide, the following yardstick to identify the inflation glidepath might prove useful. The research team at Deutsche Bank looked at what normally transpires when inflation in an economy hits 8%. The study utilised 50 developed and developing market countries, comprising 126 unique observations and covering over 50 years of data (post the 1970 break with Bretton Woods):

(source: GFD, Bloomberg Finance, Deutsche Bank)
The conclusion is that, contrary to current consensus expectations which are amongst the most optimistic over this period, it would be unusual (caveat: not impossible) to see inflation fall back quickly to previous levels.
At the time of writing, the current inflation rates across the Group of Twenty (G20) nations, an intergovernmental forum comprised of the world’s largest economies accounting for approximately 80% of global world product and 70% of international trade, read 8%+ for eight countries (including Germany, Italy, the United Kingdom, the United States and Russia), as well as the broader Eurozone:

(source: www.tradingview.com)
Future portfolio effect
As we have witnessed so far this year, a combination of soaring inflation, rapidly tightening monetary policy and deteriorating growth is the antithesis of investment conditions that have defined the past 25 years. Against the backdrop above, allocators should prepare for a change in cross-asset relationships, notably between bonds and equities.
With that in mind, our assessment is that today’s stewards of capital need to consider expanding their multi asset allocation menu, particularly in areas such as absolute return strategies, volatility dampeners, real assets, and alternative income streams, securities that exhibit conventional bond characteristics, namely lower than equity volatility and a sustainable and attractive yield.
Equally important will be flexibility in one’s investment framework to take advantage of short-term opportunities that episodes of volatility and dislocation will bring.
Looking Ahead
In the UK and Europe, helicopter hand-outs to consumers and profit caps on energy producers are pouring petrol on the inflation fire, increasing aggegate demand at the same as restricting supply. Political pressure has superseded common sense. The populist ESG and ‘green’ agenda have also ensured that little to no new infrastructure investment has taken place for a decade. Energy commodities remains attractive.
The UK, post a healthy dose of political and market drama, stands out in both a valuation and cash flow context, whilst sterling’s dramatic plunge will have corporate raiders sharpening their pencils.
A similar scenario applies to Japan in a Far East context, where the Bank of Japan Governor Kuroda’s yield curve control policy has crushed the yen. Listed companies are cheap, evidenced by a quadrupling of share buybacks over the past decade, and flush with cash, with non-financial listed companies currently holding ¥143 trillion of cash. A potential kicker exists in the form of a reintroduction of tax-efficient savings schemes.
In the US, fast-moving consumer data (airlines, home sales, new and used car prices, semiconductor chips, global shipping rates) is beginning to fall, in some cases sharply. Amazon vendors are ‘cutting prices, adding coupons’ ahead of an expected bleak holiday season to shift a mountain of inventory. FAANG stocks and associated sectors such as warehousing, logistics and commercial property look particularly vulnerable.
The data the Fed is currently observing to influence decisions acts with a lag. This is likely to both extend the global inflation cycle and ensure that the interest rate pedal is kept to the metal, pressuring risk assets. With that said, everything comes at a price, and the repricing in sovereign and investment grade debt has been short and sharp. Selective issues now look relatively attractive on a reward-to-risk basis.
Rather than blindly chase pockets of risk, our investment framework continues to stress diversification, retaining healthy exposure to several assets that should provide ballast were fragile conditions to re-emerge anytime soon.
As always, our models will continue to act and serve as our investment compass. If the evidence changes, so shall our view. We anticipate taking advantage of further opportunities for our clients over the coming quarters.